Download
1 / 14
140 likes | 238 Views
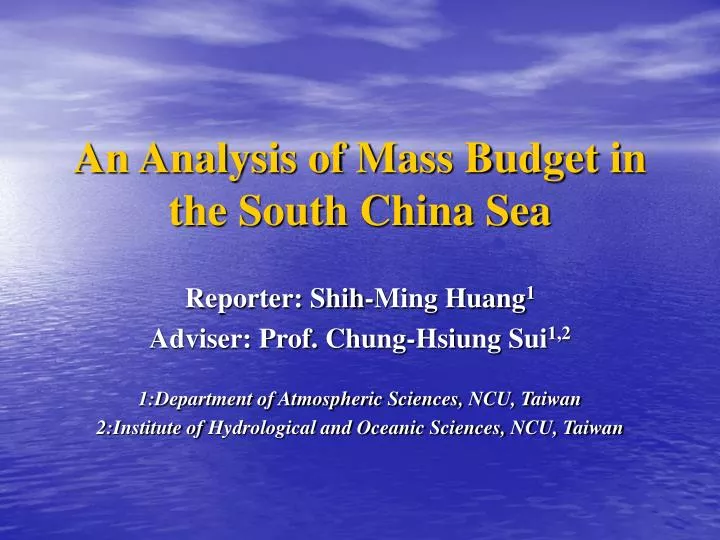
An Analysis of Mass Budget in the South China Sea. Reporter: Shih-Ming Huang 1 Adviser: Prof. C hung -H siung Sui 1, 2 1:Department of Atmospheric Sciences , NCU, Taiwan 2: Institute of Hydrological and Oceanic Sciences, NCU, Taiwan. Outline :. Introduction

E N D
An Analysis of Mass Budget in the South China Sea Reporter: Shih-Ming Huang1 Adviser: Prof. Chung-Hsiung Sui1,2 1:Department of Atmospheric Sciences, NCU, Taiwan 2:Institute of Hydrological and Oceanic Sciences,NCU, Taiwan
Outline: • Introduction • Ocean Data and General characteristics • Luzon Straitand SCS Mass Transport • Summary
Introduction: • Being the largest marginal sea in the tropics, the South China Sea (SCS) connects with two major oceans, the Pacific and Indian Oceans [Shaw et al.,1996; Xie et al.,2003; Chang et al., 2008]. • Circulation in the SCS basin is driven by the southwest monsoon in summer and the northeast monsoon in winter. The resulting summer anti-cyclonic gyre and the winter cyclonic gyre as well as the transition between them have been documented by Wyrtki’s [1961]. • At shallow depths, upwelling is present off Vietnam in summer and off northwest Luzon in winter, and shelf break upwelling appears on the edge of Sunda Shelf from October to December, when the southward coastal jet impinges on the shelf [Chao et al., 1996]. • We use the Simple Ocean Data Assimilation (SODA)monthly data to estimate the annual and interannual change of the massbudgets in the South China Sea (SCS).
Ocean Data and General characteristics: 1. Ocean Data: Simple Ocean Data Assimilation 1.4.2 (SODA) : • Model: • POP based on MOM2 • Time: • 44 yrs; 1958~2001; monthly • Resolution: • 0.25°x 0.4° ave on 0.5°x 0.5°; 40 levels • Data: • Hydrography (XBTs, CTDs …); Satellites (SST…) • Forcing: • ERA-40 wind stress; GPCP precipitation; Bulk formulae for heat fluxes • (Carton et al., 2006)
2. General characteristics: (a) Winter: northeast monsoon wind→ wund stress Curl (+ in south, upwelling; - in north ,downwelling)→ cyclonic gyre Summer: southwest monsoon wind→ wund stress Curl (+ in north, upwelling; - in south, downwelling)→ anticyclonicgyre (b)
Centurioni et al.,2006 JPO (a) (b) Drifters data 1987~2002 (d) (c)
(AMJ) (JFM) (a) Drifters data (JAS) (OND) Centurioni et al., 2006 JPO (b)
Luzon Strait& SCS Mass Transport: Transport : Net transport: Net zonal + Net meridional (Positive In /Negative Out) unit: 106 m3/s = Sv (Suf=0) 19.75°E Meridional current (v) 16.75°E (N) (E) (w) (S) Zonal current (u) (bottom=400m) 114.25°E Vertical velocity (w) 117.25°E
1. Luzon Strait transport: Sandwiched vertical structure (Tian et al., 2006) SE monsoon Wind (a) (b) FIG. Vertical distribution of the Luzon Strait transport (104 m2 s-1) against depth (m): (a) annual mean; (b) seasonal variation.
(a) (b) 44yr Annual mean (u): LST(0~381) = -2.40 Sv LST(0~bottom) = -1.77 Sv Sandwiched vertical structure • Winter: KT↓→LST↑ • NE-wind → KT↓→LST↑ • Mindanao Dome → KT↓→LST↑ • (Yaremchuk and Qu 2004) • Summer: KT↑→LST↓ • SW-wind→ KT↑→LST↓ ADCP obs Oct 4~16,2005 (Tian et al., 2006)
2. SCS Mass transport: • 44yr Annual mean (In/Out): • Luzon = 2.40 Sv • Singapore = -0.13 Sv • Balabac = 0.3 Sv • Sunda = -0.91 Sv • Taiwan = -0.96 Sv • Mindord = -0.01 Sv • Net transport (0~381m) = 0.69 Sv (a) Con, Downwelling Div, Upwelling • The annual cycle of mass balance in the SCS is dominated by the mass flux into the Luzon Strait in the upper layer that is largely balanced by the horizontal mass flux through the Sunda Shelf and Taiwan Strait, and downward flux into the deeper water in the SCS.
(a) Wind Stress & Curl • Winter: • Upwelling : south China continental slop, off Vietnam, off Palawan, edge of sunda shelf • Downwelling : central SCS, west side of Luzon & Luzon strait • → Basin-wide circulation induced downwelling & coast upwelling & shelf break upwelling • Summer: • Upwelling : off Vietnam, off Palawan, edge of sunda shelf • Downwelling : west side of Luzon & Luzon strait • →Wind induced coast upwelling off Vietnam • → Basin-wide circulation induced downwelling & coast upwelling & shelf break upwelling (b) Current transport & W
Summary • The SODA data can reasonably simulate and represent the characteristic of observation data (drifter and ADCP) of the SCS. • The annual cycle of mass balance in the SCS is dominated by the mass flux into the Luzon Strait in the upper layer (above 400 m) that is largely balanced by the horizontal mass flux through the Sunda Shelf and Taiwan Strait, and downward flux into the deeper water in the SCS. • The latter leaves the SCS through the Luzon Strait below 400 m. The mass flux through the Luzon Strait is strong (weak) in the winter (summer) when the Kuroshio transport is weak (strong). • The basin-wide circulation dominated the vertical transport in the SCS, but the upwellingoff Vietnam primarily caused by Wind in summer.