Download
1 / 32
320 likes | 470 Views
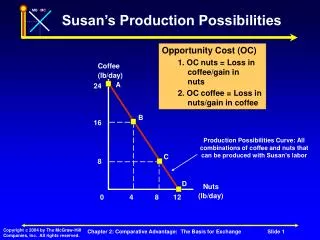
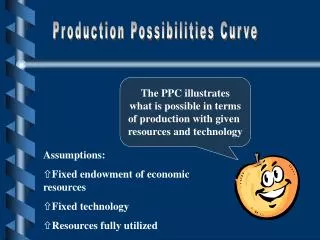
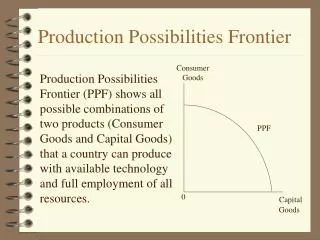
Production Possibilities. When faced with SCARCITY of resources, decisions have to be made about how to use those resources. Trade-offs Opportunity Costs. Trade-Offs. This is the decision making process that is occurring in your mind right now!

E N D
When faced with SCARCITY of resources, decisions have to be made about how to use those resources Trade-offs Opportunity Costs
Trade-Offs • This is the decision making process that is occurring in your mind right now! • Am I going to pay attention to what Mr. Hayward is saying, or am I going to daydream? • Am I going to come to class or go buy a lottery ticket? • Am I going to stay in school or go find a full time job? • Each and every decision you make has a cost!! Not necessarily a cost in dollar terms, but a cost in that you must give up something in order to get more of something else.
Opportunity Cost • The “price you pay” for each decision you make is called the OPPORTUNITY COST. • Opportunity cost is vital to the understanding of economics. • “The amount of a product or service that must be forgone (given up) in order to obtain more of the next best alternative product or service”
Production Possibilities Frontier • Used to illustrate: • Productive Capacity • Opportunity Costs • Efficiency • Productive • Allocative • Economic Growth/Decline • Vital Link to Aggregate Supply (short/long run)
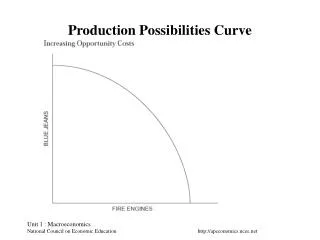
Production Possibilities FrontierIncreasing Opportunity Costs . . . 80 70 60 50 40 20 10 Wheat Rice Wheat . 80 78 70 55 38 0 0 20 40 60 80 100 -2 +20 -8 +20 . -15 +20 -17 +20 -38 +20 . NOTE: The GAIN in Rice is CONSTANT while the LOSS In Wheat is INCREASING each Time…What is going on??? 0 10 20 30 40 50 60 70 80 90 100 Rice
Production Possibilities FrontierIncreasing Opportunity Costs • The type of land resource suitable for growing Wheat is DIFFERENT than the land resource for growing Rice. • If a society wants MORE Rice, then as you convert land suitable for growing Wheat (arable, relatively dry) so that you can grow Rice (wet, swampy) it will become MORE costly to do that, in terms of Wheat production • We have INCREASING OPPORTUNITY COSTS of producing Rice in terms of Wheat
Production Possibilities Frontier • Economy’s produce MORE that just Wheat and Rice. • We produce LOTS of goods of many different types. • We can broadly categorize goods into TWO categories • Capital Goods and Consumer Goods
The best way to illustrate Trade-Offs and Opportunity Costs is to use a Production Possibilities Curve The PPC shows the relationship between two goods: 1. Capital Goods (Investment Goods) Goods that satisfy our wants INDIRECTLYand promote future growth or “happiness” – Delayed gratification. 2. Consumer Goods Goods that satisfy our wants DIRECTLY. Instant Gratification Lesson 1 Act 1
Production Possibilities Frontier . . A Capital Goods “Stuff you use to make other Stuff” Tools, equipment, factories, other infrastructure Capital Goods B . C Consumer Goods “Stuff” for immediate Consumption. Food, consumer Electronics, etc. . D Allocative Efficiency Where a society decides to Produce on its PPF. A value Decision based on values/politics . E 0 Productive Efficiency Full-employment of resources And producing at the lowest cost Consumer Goods
Production Possibilities Curve (Frontier) • The reason the PPC is bowed is because of INCREASING OPPORTUNITY COSTS. • At Point “A” the economy gives up 10 capital goods in order to get 400 consumer goods. • 400 Consumer goods = 10 Capital goods • 1 Consumer good = 10 Capital goods/400 • 1 Consumer good = .025 Capital good 100 .A .B .C 10 20 30 40 50 60 7 0 80 90 Capital Goods .D 0 1000 100 200 300 400 500 600 700 800 900 Consumer Goods
Production Possibilities Curve (Frontier) • The reason the PPC is bowed is because of INCREASING OPPORTUNITY COSTS. • At Point “B” the economy gives up 10 Capital goods in order to get 200 more Consumer goods. • 200 Consumer goods = 10 Capital goods • 1 Consumer good = 10 Capital goods/200 • 1 Consumer good = .05 Capital good 100 .A .B .C 10 20 30 40 50 60 7 0 80 90 Capital Goods .D 0 1000 100 200 300 400 500 600 700 800 900 Consumer Goods
Production Possibilities Curve (Frontier) • The bowed nature of the PPC is due to INCREASING OPPORTUNITY COSTS • Not all resources are adaptable to alternative uses. • Resources used for Capital Goods may not be suitable to make Consumer Goods (and Vice Versa) • Marsh land suitable for growing rice could not easily be converted for use as a an airport. It would be much more costly than using farmland in Kansas. 100 .A .B .C 10 20 30 40 50 60 7 0 80 90 Capital Goods .D 0 1000 100 200 300 400 500 600 700 800 900 Consumer Goods
Production Possibilities Curve (Frontier) • Lets take a closer look at the PPC. • What do the different points on the PPC represent? 100 .A .B .C .D 0 1000 100 200 300 400 500 600 700 800 900 Consumer Goods
Production Possibilities Curve (Frontier) • Each point represents Productive Efficiency • This means that this economy is allocating ALL of it productive resources in the least costly way 100 .A .B .C .D 0 1000 100 200 300 400 500 600 700 800 900 Consumer Goods
Production Possibilities Curve (Frontier) • There are an infinite number of points on the PPC. Where a society decides to produce is called Allocative Efficiency • This represents the combination of Capital and Consumer Goods most desired by the society 100 .A .B .C .D 0 1000 100 200 300 400 500 600 700 800 900 Consumer Goods
Production Possibilities Curve (Frontier) • The WHOLE PPC represents • “FULL PRODUCTION” • Productive Efficiency • Full-Employment of Resources 100 .A .B .C .D 0 1000 100 200 300 400 500 600 700 800 900 Consumer Goods
Production Possibilities Curve (Frontier) Do economy’s always produce on the PPC? No! Often they operate inside their production possibilities .A 100 .B .C E .D 0 1000 100 200 300 400 500 600 700 800 900 Consumer Goods
Production Possibilities Curve (Frontier) Do economy’s always produce on the PPC? Point “E” represents a point inside the PPC. Notice that this point “E” represents a lower bundle of Capital and Consumer Goods .A 100 .B .C .E .D 0 1000 100 200 300 400 500 600 700 800 900 Consumer Goods
Production Possibilities Curve (Frontier) Do economy’s always produce on the PPC? Point “E” represents a point inside the PPC. The area between point “E” and the PPC represents underutilization of resources or under-employment of resources or unemployment. The economy is being inefficient. .A 100 .B .C .E .D 0 1000 100 200 300 400 500 600 700 800 900 Consumer Goods
Production Possibilities Curve (Frontier) Do economy’s always produce on the PPC? Point “E” represents a point inside the PPC. This economy could be doing better… .A 100 .B .C .E .D 0 1000 100 200 300 400 500 600 700 800 900 Consumer Goods
Production Possibilities Curve (Frontier) Do economy’s always produce on the PPC? How about point “F”? Point F is outside our PPC It represents a combination of Capital and Consumer Goods that is currently not possible with this economies resources .A 100 .B .F .C E .D 0 1000 100 200 300 400 500 600 700 800 900 Consumer Goods
Production Possibilities Curve (Frontier) Do economy’s always produce on the PPC? How about point “F”? Point F is outside our PPC This point is desirable (more “stuff”) but currently not attainable. .A 100 .B .F .C E .D 0 1000 100 200 300 400 500 600 700 800 900 Consumer Goods
Production Possibilities Frontier . . . A Capital Goods “Stuff you use to make other Stuff” Tools, equipment, factories, other infrastructure Capital Goods G B . C Consumer Goods “Stuff” for immediate Consumption. Food, consumer Electronics, etc. . . D F Allocative Efficiency Where a society decides to Produce on its PPF. A value Decision based on values/politics . E 0 Productive Efficiency Full-employment of resources And producing at the lowest cost Consumer Goods
Production Possibilities CurveThe PPC shows ALL possible combinations of two goods that can be produced if ALL available resources are fully employed (used) with the best technology currently available How do we get to point G?? 1. Technological advancement which increases Productivity 2. Discover new resources 3. Take resources (War) 4. Trade for Resources A B G C Robotics (Capital Good) D F E Compact Discs (Consumer Good) “OUR ECONOMY IS DRIVEN BY TECHNOLOGICAL ADVANCEMENT” CAN YOU THINK OF AN EXAMPLE IN HISTORY WHEN WE WERE INSIDE THE PPC?
Production Possibilities CurveThe PPC shows ALL possible combinations of two goods that can be produced if ALL available resources are fully employed (used) with the best technology currently available How do we get to point G?? 1. Technological advancement which increases Productivity 2. Discover new resources 3. Take resources (War) 4. Trade for Resources A B G C Robotics (Capital Good) D F E Compact Discs (Consumer Good) “OUR ECONOMY IS DRIVEN BY TECHNOLOGICAL ADVANCEMENT” CAN YOU THINK OF AN EXAMPLE IN HISTORY WHEN WE WERE INSIDE THE PPC?
Economic resources are not completely adaptable to alternative uses. The “curve” indicates a “changing trade-off.” Obtaining more of one good requires giving up larger amounts of the alternative good. Possibilities-A, B, C, D, & E Impossibility [more/better resources, better technology]
So, How Is Economic Growth Demonstrated on a PPC Graph? Economic Growth [Ability to produce a larger total output over time] d a e Capital Goods b f C 0 Consumer Goods
PRODUCTION POSSIBILITIES Two Examples of Economic Growth FAVORING PRESENT GOODS CURRENT CURVE Goods for the Future CONSUMPTION Goods for the Present
PRODUCTION POSSIBILITIES Two Examples of Economic Growth FAVORING PRESENT GOODS CURRENT CURVE Goods for the Future CONSUMPTION Goods for the Present
PRODUCTION POSSIBILITIES Two Examples of Economic Growth FAVORING PRESENT GOODS FAVORING FUTURE GOODS CURRENT CURVE CONSUMPTION FUTURE CURVE FUTURE CURVE Goods for the Future Goods for the Future CURRENT CURVE CONSUMPTION Goods for the Present Goods for the Present
Going to War (U.S.)When the U.S. entered WWI, we had severe unemployment. We were able to step up production of consumer goods and war materials simply by getting to full production. We went from 14.6% unemployment in 1940 to 1.2% in 1944. Over 7 million people went to work that were not working in 1940. United States [Beginning of WWII] C War Goods F Civilian Goods Going to War(Russia).Russia, on the other hand, entered WWII at full capacity. So their preparedness entailed a shifting of resourcesfrom civilian goods and a drop in their standard of living. The U.S.position was similar as weentered the Viet Nam War at full employment. We increased both military spending and domestic spending on the “War on Poverty.”Our attempt to achievemore “guns and butter” in a FE economy was doomed. We were trying to spend beyond capacity and ended up with double digit inflation in the 1970s. C Russia [Beginning of WWII] War Goods D Civilian Goods