Download
1 / 8
80 likes | 85 Views
Explore the spatial fluctuation of road temperature and friction using new equipment, identify sensitive areas of road slipperiness, and analyze different weather phenomena causing slipperiness. Utilize Vaisala DSC111 sensor for remote surface state sensing, measuring water, ice, slush, snow or frost layer thickness, and friction coefficient.

E N D
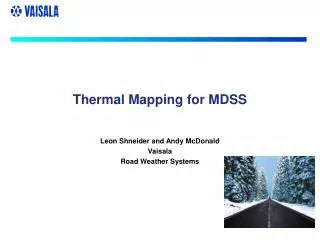
Mobile friction observations and thermal mapping in Testbed area Helsinki Testbed mesoscale course Toni Hellinen and Marjo Hippi
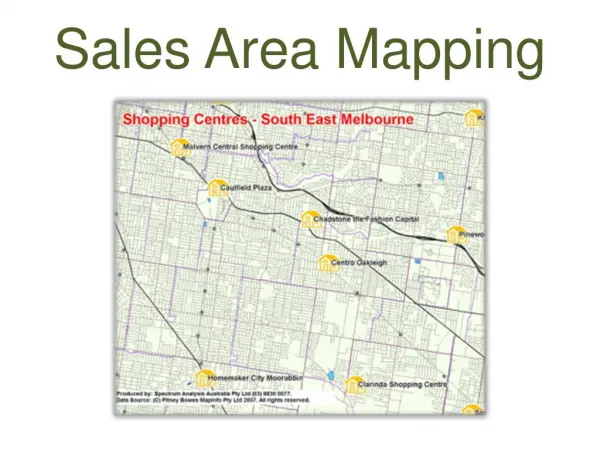
Motivations • Interest of using new equipments • Researching the spatial fluctuation of road temperature and friction • Finding the sensitive places of road slipperiness • Identification of different weather phenomena that cause slipperiness on roads
Vaisala Remote Road Surface Condition Sensor DSC111 • Remote surface state sensing • Measuring • thickness of • water • ice • slush • snow or frost layer • friction coefficient (0-1) • Parallel use with remote temperature sensor • Both attached to vehicle
Observations • Mobile measurements from ColdSpots project data • Comparable data from road weather stations in Testbed area • Mobile measurements were done in interesting weather situations • Thawing period • Snowing period • Cold slippery (surface temperature below -7 C and light snow) • Slush period
Conclusions • Research three different occasions • Vt1 23.1.2007: Snowing • Vt6, Vt7 26.1.2007: Thawing and snowing • Vt6, Vt7 27.1.2007: Slush • Comparing optical friction and temperature measurements to road weather observations and radar data