Download
1 / 40
400 likes | 529 Views
Estimated 2009 State Population is 9,969,727 . Ethnic Makeup of Michigan. 79.6% Anglo 14.3% African American 3.7% Hispanic 5.3% Foreign Born (14.1% Nat. Avg.). Foreign Born Population. The foreign-born population increased by 11.3% percent between 2000 and 2008

E N D
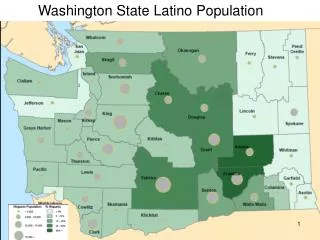
Ethnic Makeup of Michigan • 79.6% Anglo • 14.3% African American • 3.7% Hispanic • 5.3% Foreign Born (14.1% Nat. Avg.)
Foreign Born Population • The foreign-born population increased by 11.3% percent between 2000 and 2008 • The top three countries of birth of the foreign born in Michigan were Mexico, India, and Canada • 14.2% Mexico • 8.4% India • 6.8% Canada
Michigan Immigration • Ranks #1 in the U.S. for refuges from Iraq • Ranks #1 in the U.S. for refuges from Lebanon • Ranks #4 in the U.S. for refuges from Syria • Ranks #5 in the U.S. for refuges from Burundi, Jordan, Laos and Romania • Ranks #16 in the U.S. for illegal immigration
Top Languages Spoken at Home • English Only 8,487,400 • Spanish 246,680 • Arabic 75,410 • German 52,320 • Polish 40,370 • Italian 30,050
Michigan Health Statistics • High cholesterol – Highest in the nation • Adult diabetes – 7th highest in the nation • Obesity – 4th highest in the nation • Prevalence of poor mental health – 3rd highest • Enrolled in medicaid – 5th highest • Births to unwed mothers – 39.4%
Michigan Crime Statistics • Aggravated Assault – 6th in the nation • Burglary – 8th in the nation • Forcible Rape – 4th in the nation • Gun Violence – 6th in the nation • Total hate crimes – 3rd in the nation • Homicide - 6th in the nation • Motor Vehicle Theft – 5th in the nation
Juvenile Arrests In 2006 there were 30,352 arrests of juveniles between the ages of 10 and 16 There was a 41.7% increase in the number of juveniles arrested for violent crimes since 2000.
U.S. Census shows Michigan having more than 16% living below poverty level (National percentage is 14.3%)
Educational Attainment • Less than HS 12% • HS or Equivalency 32% • Some College 23% • Associate 8% • Bachelor’s 15% • Graduate 9%
In 2005 there were 20,498 Children in Foster Care 41.6% of foster children are between the ages of 13 and 21
Detroit • Over 80% of population is African-American • Poverty rate of 33.8% • Unemployment rate close to 14.3% • Literacy rate of less than 50% • Most stressful place to live and work • Ranks in the top 10 among top 50 metros with most heart attacks, murders, robberies, families in poverty, and fewest sunny days.
Church Membership in MI • 2,019,926 Catholic • 1,079,117 Evangelical • 783,541 Mainline Protestant • 46,294 Orthodox • 228,031 Other • 5,781,535 Unclaimed • 81.2% are Not Evangelicals
ACP Data 2000 2009 # of Churches 262 260 Resident Members 30,254 34,788 Worship Attn. 20,887 22,283 Baptisms 1,659 1,243 Tithes & Offerings 20,480,873 28,144,993 Cost per Baptism 9,659 22,643
Michigan SBC Churches by Ethnicity • Anglo 74.39% • African American 14.04% • Hispanic 2.81% • Korean 1.75% • Filipino 1.75% • Hmong 1.05% • Multi-Ethnic 0.70%
Total SBC Churches • 2009 251 • 2008 251 • 2007 246 • 2006 260 • 2005 258 • 2004 260 • 2003 259 • 2002 262 • 2001 262 • 2000 262 • 1999 259 • 1998 258 • 1997 261 • 1996 258 • 1995 252
2008 Michigan Church Size(Total Members vs. SBC) • 1 -99 55.9% 34.4% • 100-199 18.8% 21.0% • 200-399 14.1% 21.6% • 400-749 8.2% 13.1% • 750-1,999 2.7% 8.0% • 2,000 + 0.4% 2.0%
2008 Michigan Church Size(Church Size and Baptisms) • 1 -99 21.7% 9.5% • 100-199 29.1% 11.5% • 200-399 21.6% 17.7% • 400-749 16.2% 18.3% • 750-1,999 7.4% 21.2% • 2,000 + 4.0% 22.0%
Baptisms per 100 Resident Members • Churches less than 10 years old have 7.5 baptisms per 100 resident members • Churches older than 9 years have 3.6 baptisms per 100 resident members • Nationally (7.5 and 3.4)
Number of churches constituted by decade • 1920’s 3 • 1930’s 5 • 1940’s 4 • 1950’s 52 • 1960’s 36 • 1970’s 21 • 1980’s 47 • 1990’s 37 • Current 50
New Churches Reported in ACP Data • 1999 10 • 2000 31 • 2001 21 • 2002 15 • 2003 7 • 2004 18 • 2005 22 • 2006 13 • 2007 14 • 2008 17 • 2009
Church Plants in MI • 40% Urban, 20% Suburban, 8% Rural • 55% of planters are from MI • 40% of church plants target Anglos • 73% planted in the last five years are still in existence • 7% of Church plants average more than 100 in worship • Of those running over 100, 67% have MI planters
Factors That Influence Success • Churches and Christ Followers discovering lostness and God creating within them a vision for ministry in the harvest and reaching their city • A “farm system” built upon disciple making, small group formation, leader identification and multiplication • Churches that are both attractional and missional
Factors That Influence Success • Missional foundations as the basis for development • From leadership development to leader development • Peer to peer learning environments • Support beyond finances • Accountability through coaching
Factors That Influence Success • Collaboration among churches, leaders and disciples • Team Church Planting • Recentralization • The multiplication of disciples, small groups, leaders, & churches • Missionary pattern of sowing the gospel, disciple making, small group formation and leader development
Following the leadership of the Holy Spirit we will join Kingdom partners to intentionally engage every pocket of people in the state so that they can understand and experience the gospel and mature in Christ with a reproducing indigenous church.
Church Planting Systems • Awareness • Enlistment • Equipping • Multiplication • Cultivation • Selection • Development • Support
Suggested Systems • Awareness of lostness and God’s activity • Cultivation of leaders and partners • Selection • Development of leaders • Support
Awareness …build awareness of lostness, God’s activity in their midst and the need to sow the gospel and make disciples in a way that makes sense to a specific group of people or place
Cultivation … cultivate leaders and ministry partners who collaborate together to advance the Kingdom of God
Selection … based upon a pre-determined set of values leaders are selected and assessed to aid in their personalized development
Development … the development of healthy, reproducing leaders
Support … the resourcing of leaders, their families and teams so that they can fulfill their God given vision