Download
1 / 9
90 likes | 254 Views
The Human Component of the Global Carbon Cycle. Global Greenhouse Gas Information System Workshop 15-16 October, 2008 California Institute of Technology Pasadena, California, USA Gregg Marland Environmental Sciences Division Oak Ridge National Laboratory and Tom Boden

E N D
The Human Component of the Global Carbon Cycle Global Greenhouse Gas Information System Workshop 15-16 October, 2008 California Institute of Technology Pasadena, California, USA Gregg Marland Environmental Sciences Division Oak Ridge National Laboratory and Tom Boden Oak Ridge National Laboratory, USA Khrystyna Hamal Lviv Polytechnic National University, Ukraine Matthias Jonas International Institute for Applied Systems Analysis, Austria
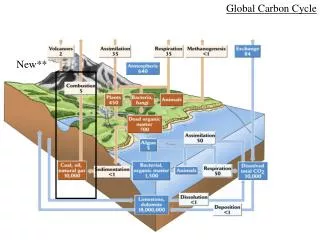
1850 1870 1890 1910 1930 1950 1970 1990 2010 Anthropogenic C Emissions: Fossil Fuel 2007 Fossil Fuel: 8.5 Pg C [Total Anthrop.Emis.:8.5+1.5 = 10.0 Pg] • 1990 - 1999: 0.9% y-1 • 2000 - 2007: 3.5% y-1 Updated from Raupach et al. 2007, PNAS; Canadell et al 2007, PNAS
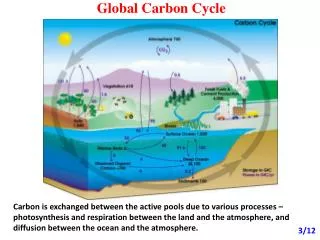
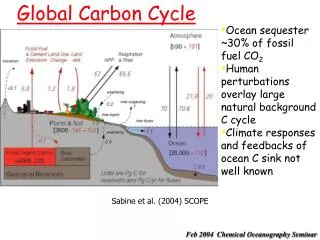
Perturbation of Global Carbon Budget (1850-2006) 2000-2006 fossil fuel emissions 7.6 Source deforestation 1.5 CO2 flux (Pg C y-1) atmospheric CO2 4.1 Sink land 2.8 ocean 2.2 Time (y) Le Quéré, unpublished; Canadell et al. 2007, PNAS
Cumulative fraction of total fossil-fuel emissions - 2005 number of country cumulative countries fraction 1 USA .206 2 China .403 3 Russia .459 4 India .509 5 Japan .552 6 Germany .580 7 Canada .601 8 UK .621 9 Iran .638 10 Mexico .655 20 Ukraine .793 50 Belarus .941 100 Moldova .992 211 1.000
Sources of US anthropogenic CO2 emissions - 2006 • Fossil fuel combustion 1537.5 Tg C • Non-energy use of fossil fuels 37.6 • Iron and steel manufacture 13.4 • Cement production 12.5 • Gas flaring/venting/leakage 7.8 • Other industrial processes 22.9 • Total 1631.7 From US EPA, 2008