Download
1 / 54
540 likes | 654 Views
High Density Oligo Arrays for S ingle F eature P olymorphism Genotyping and Mapping Justin Borevitz Ecology & Evolution University of Chicago http://naturalvariation.org. Which arrays should be used?. Spotted arrays Arizona 29,000 - 70mers ATH1, Affymetrix expression GeneChip

E N D
High Density Oligo Arrays forSingle Feature PolymorphismGenotyping and Mapping Justin BorevitzEcology & EvolutionUniversity of Chicagohttp://naturalvariation.org
Which arrays should be used? • Spotted arrays Arizona 29,000 - 70mers • ATH1, Affymetrix expression GeneChip 202,806 unique 25bp oligo nucleotides features • AtTILE1, universal whole genome array every ~35bp, > 3Million PM features • Re-sequencing array 120M*8bp • 20 Accessions, Perlegen, • Max Planck (Weigel), USC (Nordborg) GeneChip
Universal Whole Genome Array RNA DNA Chromatin Immunoprecipitation ChIP chip Gene Discovery Gene model correction Non-coding/ micro-RNA Antisense transcription Methylation Transcriptome Atlas Expression levels Tissues specificity Polymorphism SFPs Discovery/Genotyping Comparative Genome Hybridization (CGH) Insertion/Deletions Alternative Splicing ~35 bp tile, non-repetitive regions, “good” binding oligos, evenly spaced
ChipViewer: Mapping of transcriptional units of ORFeome From 2000v At1g09750 (MIPS) to the latest AGI At1g09750 2000 v Annotation (MIPS) The latest AGI Annotation
Improved Genome Annotation ORFa Transcriptome Atlas ORFb start AAAAA deletion M M M M M M M M M M M M SFP SNP SNP SFP SFP conservation Chromosome (bp)
Talk Outline • Single Feature Polymorphisms (SFPs) • Barley SFPs • Uses of SFPs • Haplotype analysis • Expression
Spatial Correction Improved reproducibility Next: Quantile Normalization Spatial Artifacts
False Discovery and Sensitivity • Cereon • may be a • sequencing • Error • TIGR • match is • a match 90% 80% 70% 41% 53% 85% 90% 80% 70% 67% 85% 100% 3/4 Cvi markers were also confirmed in PHYB PM only GeneChip SAM threshold SFPs nonSFPs Cereon marker accuracy 5% FDR 3806 89118 100% Sequence 817 121 696 Sensitivity Polymorphic 340 117 223 34% Non - polymorphic 477 4 473 False Discovery rate: 3% Test for independence of all factors: Chisq = 177.34, df = 1, p - value = 1.845e - 40 GeneChip SAM threshold SFPs nonSFPs Cereon marker accuracy 18% FDR 10627 82297 100% Sequence 817 223 594 Sensitivity Polymorphic 340 195 145 57% Non - polymorphic 477 28 449 False Discovery rate: 13% Test for indep endence of all factors: Chisq = 265.13, df = 1, p - value = 1.309e - 59
Effect of SNP position 340 Candidate Polymorphisms False negative True Positive
Complex Genomes? • Signal to Noise with Large Genomes • RNA, less complex, but differential expression
Barley SFPs RNA 2 genotypes, 18 replicates
Barley SFPs Genomic DNA 3 genotypes 3 replicates
Uses of SFPs • Recombination Events • Mapping Mendelian mutations • Mapping QTL • Deletions • Haplotyping
Chip genotyping of a Recombinant Inbred Line 29kb interval Discovery 6 replicates X $500 12,000 SFPs = $0.25 Typing 1 replicate X $500 12,000 SFPs = $0.041
100 bibb mutant plants Map bibb 100 wt mutant plants
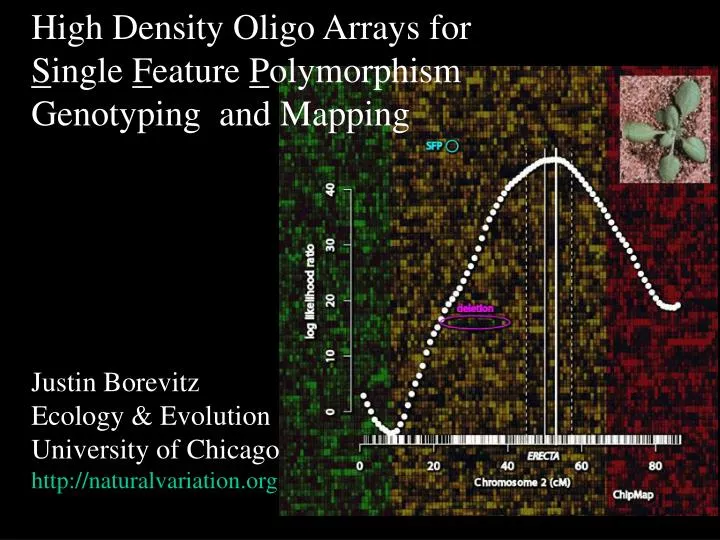
bibb mapping Bulk segregant Mapping using Chip hybridization bibb maps to Chromosome2 near ASYMETRIC LEAVES1 AS1 ChipMap
BIBB = ASYMETRIC LEAVES1 AS1 (ASYMMETRIC LEAVES1) = MYB closely related to PHANTASTICA located at 64cM as1 bibb Sequenced AS1 coding region from bib-1 …found g -> a change that would introduce a stop codon in the MYB domain bib-1 W49* as-101 Q107* bibb as1-101 MYB
Array Mapping chr1 chr2 chr3 chr4 chr5 Hazen et al Plant Physiology (2005)
eXtreme Array Mapping 15 tallest RILs pooled vs 15 shortest RILs pooled
Chromosome 2 16 12 RED2 QTL LOD 8 4 0 0 20 40 60 80 100 cM RED2 QTL 12cM Composite Interval Mapping eXtreme Array Mapping LOD Allele frequencies determined by SFP genotyping. Thresholds set by simulations Red light QTL RED2 from 100 Kas/ Col RILs (Wolyn et al Genetics 2004)
QTLLz x Ler F2 XAMLz x Col F2 (Werner et al Genetics 2005)
eXtreme Array Fine Mapping ~2Mb ~8cM Col Low RED2 QTL >400 SFPs High Kas X mark2 mark1 ~2 ~268 ~43 Kas Col Col Col het Col ~43 ~43 ~539 ~539 Kas het Col het het het het het ~268 ~2 ~43 Kas Kas Kas Kas Col het Select recombinants by PCR >200 from >1250 plants
Potential Deletions >500 potential deletions 45 confirmed by Ler sequence 23 (of 114) transposons Disease Resistance (R) gene clusters Single R gene deletions Genes involved in Secondary metabolism Unknown genes
FLM natural deletion Potential Deletions Suggest Candidate Genes FLOWERING1 QTL Chr1 (bp) MAF1 Flowering Time QTL caused by a natural deletion in FLM (Werner et al PNAS 2005)
Het Fast Neutron deletions FKF1 80kb deletion CHR1 cry2 10kb deletion CHR1
Array Haplotyping • What about Diversity/selection across the genome? • A genome wide estimate of population genetics parameters, θw, π, Tajima’D, ρ • LD decay, Haplotype block size • Deep population structure? • Col, Lz, Bur, Ler, Bay, Shah, Cvi, Kas, C24, Est, Kin, Mt, Nd, Sorbo, Van, Ws2 Fl-1, Ita-0, Mr-0, St-0, Sah-0
Chromosome1 ~500kb Col Ler Cvi Kas Bay Shah Lz Nd Array Haplotyping Inbred lines Low effective recombination due to partial selfing Extensive LD blocks
Distribution of T-stats 208,729 null (permutation) actual 32,427 Calls Not Col NA Col NA duplications 12,250 SFPs
SFPs for reverse genetics 14 Accessions 30,950 SFPs` http://naturalvariation.org/sfp
Tajima’s D like 50kb windows RPS4 unknown
Consider SFPs during expression • Remove SFPs • Allele specific expression