Download
1 / 26
260 likes | 371 Views
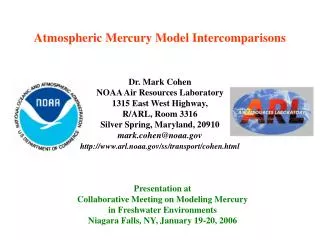
Atmospheric Mercury Measurements and Modeling at the Grand Bay NERR. Mark Cohen, Winston Luke, Paul Kelley, Roland Draxler, Fantine Ngan, and Richard Artz NOAA Air Resources Lab, Silver Spring, Maryland _____________________ Gulf of Mexico Alliance Mercury Forum May 10-12, 2010

E N D
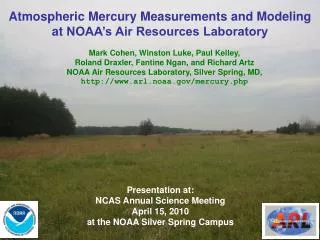
Atmospheric Mercury Measurements and Modeling at the Grand Bay NERR Mark Cohen, Winston Luke, Paul Kelley, Roland Draxler, Fantine Ngan, and Richard Artz NOAA Air Resources Lab, Silver Spring, Maryland _____________________ Gulf of Mexico Alliance Mercury Forum May 10-12, 2010 Mote Marine Lab, Sarasota, FL http://www.arl.noaa.gov/mercury.php
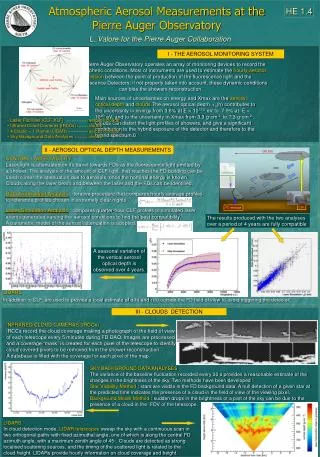
Four Collaborative Comprehensive Atmospheric Mercury Measurement Sites Part of AMNet, an emerging inter-agency speciated mercury ambient concentration measurement network Allegheny Portage with Canaan Valley Institute and National Park Service Beltsville with USEPA, Univ. of Maryland, and MD DNR 2002 Mercury Emissions data from USEPA, Envr. Canada, and CEC (kg/yr) Canaan Valley with Canaan Valley Inst. and Univ. of Maryland Appalachian Lab 5-10 Type of Source 10-50 coal-fired power plants 50-100 100–300 other fuel combustion 300–500 waste incineration 500–1000 metallurgical 1000–3500 manufacturing & other Grand Bay with Grand Bay NERR, USEPA, Mississippi Dept. of Environmental Quality, and Jackson State University
Grand Bay NERR site often sees Gulf of Mexico air masses, but is potentially influenced by several regional mercury emissions sources Monitoring Site NOAA type of source Mississippi Alabama SEARCH coal-fired power plant USGS waste incinerator UWF/FSU manufacturing Barry MS 22 metallurgical MDN paper manuf AL02 other fuel combustion Molino Pace Mobile Daniel Holcim Cement Pascagoula MSW incin OLF Crist Mobile Bay Ellyson AL24 Weeks Bay Pascagoula Watson Pensacola where the wind comes from that we see at Grand Bay haz waste incin NOAA Grand Bay NERR Hg site total atmospheric mercury emissions (kg/yr, 1999 EPA NEI) 1 – 50 50 - 100 100 - 200 200 - 400
Atmospheric Mercury Monitoring Station at the Grand Bay NERR view from top of the tower mercury and trace gas monitoring tower (10 meters)
Some of the instrumentation inside the trailer at the Grand Bay NERR site
Measurements began in 2006 and the site has evolved over time Summer 2010: Field Intensive (being planned) Sept 2006: Speciated Hg, SO2, O3, and CO measurements begin at “inland” site Aug 21 – Oct 5, 2008: site shut down due to threat of hurricanes Jan 2010: Black Carbon added Jan 2008: NO/NOy added 2005-2006: site selection 2005 2006 2007 2008 2009 2010 Feb 2007: Meteorological measurements added 2010: MS DEP adds comprehensive suite of wet deposition measurements with funding from USEPA Oct 2007: Move to “coastal” site near Pavillion; 2nd Tekran speciated Hg measurement suite added
Atmospheric mercury measurements are very challenging “Hmmm… maybe better if the tower goes vertical?”
The people who are making the measurements Winston Luke Principal Investigator, NOAA Air Resources Lab Paul Kelley Instrument engineer, data acquisition and management, NOAA Air Resources Lab Jake Walker Site Operator, Grand Bay NERR
Current Atmospheric Measurements of Ambient Air Concentrations and Meteorological Data “Speciated” Atmospheric Mercury Concentrations Trace gases and other measurements to help understand and interpret mercury data Meteorological Data
Wet Deposition Measurements added in 2010 by the Mississippi Department of Environmental Protection (Henry Folmar, Becky Comyns, others), with funding from the USEPA
Example of Ambient Concentration Measurements at the Grand Bay site The two sets of speciated mercury measurements generally track each other well Sometimes we see relatively pronounced peaks in one or more forms of mercury (in this example, RGM)
With two speciation units, can get continuous data and can also carry out methodological experiments • PINK data points: two systems were configured identically, to allow only particles less than 2.5 microns to be analyzed • BLUE data points: System 2 was altered to allow particles up to 10 microns to be analyzed • Results suggest that there may be as much mercury in the coarse (sea salt) aerosol fraction as in the fine fraction.
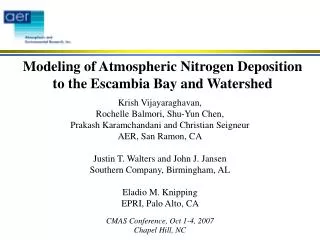
wet and dry deposition to the watershed Atmospheric Fate and Transport: Measurements and Modeling • Model evaluation? • Source attribution for deposition? • Want to provide deposition estimates to GOM ecosystem models Hg from other sources: local, regional & more distant emissions of Hg(0), Hg(II), Hg(p) Reactive halogens in marine boundary layer Measurement of ambient air concentrations • Enhanced oxidation of Hg(0) to RGM? • Enhanced deposition? Measurement of wet deposition wet and dry deposition to the water surface
HYSPLIT-Hg -- a specially configured version of the HYSPLIT atmospheric fate and transport model • Puffs or particles emitted from a source • Chemistry, dispersion and deposition simulated • Puffs grow and split • Splitting can overwhelm computational resources
HYSPLIT-Hg now includes an integrated Eulerian grid • In HYSPLIT (4.9), puffs are “transferred” to an Eulerian grid after a specified time (e.g., 96 hrs) • the mercury in those puffs is simulated on that grid from then on… • Combines plume simulation in short-range with Eulerian simulation for long-range transport
Initial Model Evaluation focusing on episodes • Can the model reproduce episodes of high measured mercury concentrations? • Can the model reproduce high mercury wet deposition episodes?
Meteorological data: a critical model input • During model evaluation exercises, want to diagnose weaknesses in model physics and chemistry, without large influence of met data errors • Would like to examine trade-off between high-resolution and coarser met data sets, which are more routinely available • Dr. VenkataDodla (JSU) and Dr. FantineNgan (NOAA ARL) are creating high resolution, ground-truthed met data sets for episodes in the region around the site (e.g., horizontal resolution of 4 km) Wind speed (shaded) & wind vector (arrows) on 5/6/08, 18 UTC (approx time of episode peak)
Emissions data: a critical model input Lowman reported dramatic drop in mercury emissions in 2008 TRI Brewton paper mill : Hg emissions in 2002 NEI , but do not appear in 2000-2008 TRI • In model evaluation, want to diagnose weaknesses in model without large influence of emissions errors • Need accurate, speciated emissions estimates for all sources impacting the site – for the time period of the episode • Need accurate emissions data for any assessment • We all need accurate emissions information. • How can we share what we already have, and improve the information where needed? CRIST: New scrubber installed Dec 2009 will dramatically reduce RGM emissions IPSCO Steel: significant Hg emissions in 2002 NEI, but negligible emissions in 2008 TRI Pascagoula MSW Incinerator shut down in Jan 2001, but still in 2002 NEI Grand Bay NERR site Large mercury emissions point sources from USEPA 2002 National Emissions Inventory (NEI)
Collaboration with Jackson State University on atmospheric mercury modeling in the region • led by Shelton Swanier and Anjaneyulu Yerramilli, the director of the Trent Lott Geospatial and Visualization Center • Manuscript in preparation analyzing the May 5-6 2008 high-RGM episode at the site. • High-resolution met data (4 km) is being generated and utilized • ALSO: JSU Professor Jerzy Leszczynski and colleagues are carrying out computational chemistry estimates of atmospherically relevant reactions of mercury Manuscript in Preparation
(Evolving) Atmospheric Chemical Reaction Scheme for Mercury • Complete? • Accurate? • Concentrations of Reactants? • What is RGM?
HYSPLIT Training http://www.ertcorp.com/HYSPLIT
Acknowledgements • Jake Walker, Mark Woodrey, Glen Ruple (Grand Bay National Estuarine Research Reserve) • Shelton Swanier, Jerzy Lesczcynski, Yerramilli Anjaneyulu, Venkatesh Dodla, Hari Dasari, & others(Jackson State Univ.) • Steve Brooks (NOAA ATDD and Canann Valley Institute) • Glenn Rolph, Barbara Stunder, Ariel Stein, Steve Fine (NOAA Air Resources Laboratory) • David Schmeltz, Tim Sharac, Rick Haeuber, Sam Napolitano (US EPA Clean Air Markets Division) • Gary Matlock, Russell Callender, Jawed Hameedi (NOAA NOS Nat’l Centers for Coastal Ocean Science) • U.S. Fish and Wildlife Service -- Grand Bay National Wildlife Refuge
Summary of NOAA ARL Mercury Measurement Sites NOAA-led measurement Co-located measurement
We may be able to measure atmospheric impacts at the site from the BP / DEEPWATER HORIZON oil spill Wind Rose estimated for the Grand Bay NERR site, for the months of May and June, from 2004-2009