Download
1 / 8
90 likes | 289 Views
Longitudinal Analysis. Setting up your Data Mart for Cohort-Based Longitudinal Analysis. Christopher M. Johnson, PhD Director of Research & Development Pat Chakravarty, Research Analyst Renton Technical College. Overview. Tracks students by cohorts Disaggregates students by demographics

E N D
Longitudinal Analysis. Setting up your Data Mart for Cohort-Based Longitudinal Analysis. Christopher M. Johnson, PhD Director of Research & Development Pat Chakravarty, Research Analyst Renton Technical College
Overview • Tracks students by cohorts • Disaggregates students by demographics • Developed with existing tools and a very small budget • Rapid prototyping system • Expand its features statewide Chris Johnson & Michelle Andreas
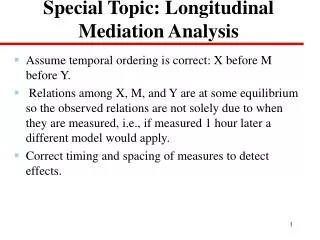
Features • Goals of Longitudinal Analysis • Pinpoint intervention areas • Identify trends • Cohort definitions • Loose - any group you want to look at with given characteristics (example, students who visited the Math lab) • Strict - Forward looking study - a group of students with characteristics that start at some point together. • Really Strict. IPEDS definition - First time, Degree Seeking, Fall t o Fall, etc. (about 5 percent of Fall enrollment) • Retrospective - take a group and looking backwards, for example, 2010 graduates. Chris Johnson & Michelle Andreas
The Reports • Reports - Standard vs. Ad hoc Analysis • Result tables - Course Enrollment, Program (plus other cohorts), Student Profile - allow for quick analysis. • Program - by Core Courses (other possibilities, CIP, EPC, etc.) • Standard Look and Feel • With training & support from Institutional Research • May be too detailed, but trying to get people to do own drilldown and familiarize themselves • Ad hocs are mainly cross tabs. Chris Johnson & Michelle Andreas
Results • 41% of Full-Time Employees • Easy access expands culture of evidence • Open door policy and faster response • Important research questions from “fishing trips” • Regular training on access and use • Feedback loop between Research & Staff Chris Johnson & Michelle Andreas
Rapid Prototype of State Project Chris Johnson & Michelle Andreas
Enhancements • New types of data. • Expansion to whole campus • Automation of Reports (stepwise) • Phased Move from Development Environment to a Production Environment (Access to SQL Server) • Developing Business Logic Feedback Loop Chris Johnson & Michelle Andreas
Thank you! Any Questions? • Public version of the Retention Model at • http://www.rtc.edu/AboutUs/ResearchDevelopment/Reports/ • Click on Interactive Cohort Retention Report (in MS Excel 2007) • Contact • Chris Johnson, Director of Research & Development. (425) 235-2352 x5713 cjohnson@RTC.edu • Pat Chakravarty, Research Analyst. (425) 235-2352 x5713 pchakravarty@RTC.edu Chris Johnson & Michelle Andreas