Download
1 / 44
440 likes | 631 Views
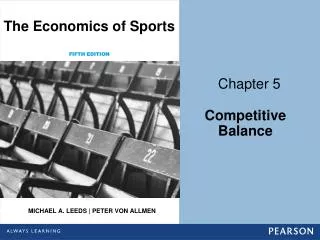
Competitive Balance. The distribution of wins in professional team sports most consistent with the maximization of league profits. Neal, Walter. “The Peculiar Economics of Professional Sports” Quarterly Journal of Economics 78 (February, 1964): 1-14. Louis- Schmelling paradox

E N D
Competitive Balance The distribution of wins in professional team sports most consistent with the maximization of league profits.
Neal, Walter. “The Peculiar Economics of Professional Sports” Quarterly Journal of Economics 78 (February, 1964): 1-14. • Louis-Schmelling paradox • The inverted joint product or the product joint • Joint product - two products technologically resulting from a single process. • Product joint - An indivisible product from the separate processes of two or more firms. • Professional baseball produces several interrelated streams of utility • In-person viewing of the game • Broadcasts of games • League standing effect • Fourth Estate Benefit • Conclusion: The several joint products which are products joint of legally separate business firms are really the complex joint products of one firm, and this firm is necessarily an all-embracing firm or natural monopoly.
Neale (1964), cont. • Four possible cases of interleague competition: • Major League Baseball solution: the joining of two leagues into one monopoly. • The professional football solution of the 1940s: The bankruptcy of one league. • Survival of two or more leagues that are not economically competitive due to geographic distances or the institutions of sport and culture. • Survival of two or more leagues that are economically competitive and which could be sportingly competitive. • The second case is the most common solution. Geographic distances and culture institutions seem to be overcome overtime (exception CFL and Japanese baseball). • In general, additional leagues bid up costs and reduce revenues, hence reducing the profitability of each league.
Uncertainty of Outcome Why is balance important? Uncertainty of outcome is crucial to the demand for sporting events. The works of Knowles, Sherony and Haupert (1992), and Rascher (1999) found that Major League Baseball attendance was maximized when the probability of the home team winning was approximately 0.6. These studies suggest that consumers prefer to see the home team win, but do not wish to be completely certain this will occur prior to the game being played. • Knowles, Glenn, Keith Sherony, and Mike Haupert. 1992. “The Demand for Major League Baseball: A Test of the Uncertainty of Outcome Hypothesis.” The American Economist, 36, n2, Fall: 72-80. • Rascher, Daniel. 1999. “A Test of the Optimal Positive Production Network Externality in Major League Baseball.” Sports Economics: Current Research, Edited by John Fizel, Elizabeth Gustafson and Lawrence Hadley. Praeger: 27-45.
Perfect Competitive Balance • But do fans want perfect competitive balance? • Teams in larger markets generate greater revenue from an additional win than teams in smaller markets. If marginal cost is the same for all teams, then teams in larger markets would maximize profits at a higher winning percentage than teams in smaller markets. • This leads to four questions… • how do we measure competitive balance? • what determines competitive balance? • how much competitive balance does a league need? • and do fans really care?
Measuring Competitive Balance • Standard deviation = [Σ(PCT actual - PCT mean)2]/number of teams]0.5 • Idealized standard deviation (if every team was equal) = (.500)/ N0.5 Where N = number of games each team plays in a season • With a normal bell shaped distribution: • 2/3 of league will be within one standard deviation • 95% will be within two standard deviations • 99% will be within three standard deviations
The Noll-Scully Measure CBit = σ(wp)itactual/ σ(wp)itideal with σ(wp)itideal = μ(wp)it / √N Where: • σ(wp)it is the standard deviation of winning percentages within league (i) in period (t) • μ(wp) it is league (i)’s mean • N is the number of teams
What determines competitive balance in professional sports? Schmidt, Martin B. and David J. Berri. (2003) “On the Evolution of Competitive Balance: The Impact of an Increasing Global Search.” Economic Inquiry, 41(4): 692-704.
Competitive Balance in the AL • Figure 1 - Noll-Scully Competitive Balance (CBt) Measures American League (AL)
Competitive Balance in the NL • Figure 1 (cont.) - Noll-Scully Competitive Balance (CBt) Measures American League (NL)
A Simple Empirical Model • Table I - OLS Trend Estimates for (CBt) • Dependent Variable (Sample - 1911 – 2000) CBt – AL Constant Time 2.742** -0.012** (0.109) (0.002) CBt – NL Constant Time 2.439** -0.008** (0.108) (0.002) • Standard errors are beneath each coefficient. • The results indicate that competitive balance improved throughout the 20th century.
What explains the pattern? • Institutional factors • The Reserve Clause • Reverse-order draft • Free agency • Revenue sharing • Payroll and Salary Caps • Expanding Populations or Talent Compression
The Belief in Institutions • Consider Commissioner Bud Selig’s comment on the recent (2002) Major League Baseball labor agreement: “. . . the issue here was competitive balance and I feel this deal clearly deals with that.“ From the news conference announcing the agreement, Friday, August 30th, 2002.
Major League Baseball’sBlue Ribbon Panel: • Convened to examine: • The Economic Stability of MLB • Competitive Balance in MLB • Four members • Yale president Richard C. Levin • Former Federal Reserve chairman Paul Volcker • Former Senator George Mitchell • Columnist George Will
The Blue Ribbon Panel:The Conclusions • a significant disparity exists in the resources member teams: • For example, for the 2000 season the salary of the highest paid player in MLB exceeded the entire payroll of the Minnesota Twins (BRP 2000; p. 9). • such differences in market size has allowed a collection of teams to consistently field playoff-contending teams. • teams located in smaller-markets are incapable of fielding teams that can challenge for post-season success. Consequently, for the smaller-market teams the outcome of the season is known before the season is started.
The Blue Ribbon Panel:Recommendations • The Blue Ribbon Panel recommended a number of changes: • recommended that foreign players be subject to the draft • teams maintain the rights of draftees beyond the one-year period they currently hold. • an annual "competitive balance draft," under which the eight clubs with the worst records could draft players not on the 40-man roster of the eight playoff teams. • Most of these seem to limit player movement or to convey greater rights to Major League Baseball teams
The Coase-Rottenberg Theorem: • “When there are no transaction costs the assignment of legal rights have no effect upon the allocation of resources among economic enterprises.” [Stigler (1988)] • ‘When there are no impediments to the buying and selling of playing talent, the assignment of the rights to this talent will have no effect upon the allocation of players among Major League Baseball teams.’ [Rottenberg (1956)]
On an empirical level • the impact of the reverse-order draft in 1965 • El-Hodiri and Quirk (1971), Demsetz (1972), and Quirk and Fort (1992) all found no tangible impact • Daly and Moore (1981) and Daly (1992) both found an improvement • the impact of the free agency in 1976 • Szymanski (2003) examines (20) empirical studies on the impact of the introduction of free-agency in 1976 on competitive balance and finds that (9) estimate an improvement, (4) document a decline and (7) found no impact
If not institutional factors, what? • Evolutionary Biologist – Stephen Jay Gould • the distribution of athletic talent in a population should be normally distributed. • At the right-tail of the distribution would lay those with the greatest level of athletic ability and assuming that there is a bio-mechanical limit to potential ability or talent, the athletes in the far right-tail tend to be relatively equal.
Gould’s Hypothesis (Part 1) • At the beginning of the 20th century, people playing Major League Baseball were only white Northeastern American males. • The population baseball could draw upon was relatively small and correspondingly, there existed a large degree of heterogeneity between players. • As the probability of winning is closely aligned with playing talent, such diversity may lead to low levels of competitive balance.
Gould’s Hypothesis (Part 2) • As the population of players Major League Baseball has to choose from rises, new players are added to the population in much the same way, i.e., normally. • The absolute number of players close to the limit would rise and, given player demand, as would the average player’s talent level or ability. • The Gould hypothesis, therefore, argues that as the talent pool rises greater player homogeneity should be observed.
Gould’s Hypothesis (Part 3) • In which case, one should see a corresponding rise in the probability of a poor team beating a stronger team • as the poor team is now stocked with players closer in talent to those of the stronger team. • Following the theme, increased player demand through, for example, expansion should decrease competitive balance. • Such increased homogeneity in talent reduces individual player differences between competing teams and therefore would increase the likelihood of a ‘less talented’ team beating a ‘more talented’ team. • This suggests that, for example, racial integration would increase competitive balance because teams were able to choose from a larger talent pool.
Baseball’s Labor Pool • Globalization of baseball is now evident on the playing fields in the United States. • Players still hail from the traditional areas of recruitment, such as the United States, Dominican Republic, Puerto Rico, Venezuela, and Cuba • Many players from Mexico, Australia, Japan, and Korea also play in the Major Leagues. Even such countries as Spain, Belgium, the Philippines, Singapore, Vietnam, Great Britain, Brazil, Nicaragua, and the Virgin Islands have produced professional baseball players. • In 2000, the number of foreign-born players on Major League Baseball rosters was 312, constituting 26 percent of all players (Levine et al, 2000).
Schmidt & Berri (2003) • Competitive Balance and Major League Baseball’s Labor Pool are cointegrated • MLB’s Labor Pool is weakly exogenous • Other factors, captured through various dummy variables, appear not to be relevant.
Back to Perfect Competitive Balance: The work of Stefan Szymanski (from the Western Economic Association meetings in 2005)Tilting the Playing Field (less)
Empirical specification for model designed to explain attendance in MLB • Data- club attendance, wins, new ballparks, strikes, 1978-2003 • Not capacity constrained • Panel regression • (Attendance)it = + i + t + i (winpercentage)it + Xit + • issues: price, alternative functional forms, lags
Estimated increase in attendance due a unit increase in win percentage (e.g. from 50% to 51%): American League
Estimated increase in attendance due a unit increase in win percentage (e.g. from 50% to 51%): National League
Attendance maximising distribution of wins in the 2003 National League
Empirical issues • Linear model fits best but is not plausible at the extremes • Almost all observed win percentages lie between 0.33 and 0.66 • Capacity constraints may bind at very high win percentages • Alternative is to fit a quadratic model to the linear estimates • This approach favours the conventional competitive balance justification for restraints
Optimal distribution of wins, American League 2003, quadratic model
Szymanski Conclusions • The impact of wins on attendance varies across the league. • In other words, fans ask more (or less) of their teams in different markets. • If Major League Baseball wished to maximize league attendance, it would not want perfect competitive balance. • Attendance would increase with less competitive balance (relative to what we see)
How does competitive balance impact league demand? According to Schmidt-Berri (2001)… • Competitive balance has a larger impact (i.e. more competition leads to more demand) the longer the time period one considers. • In other words, balance across three years has a smaller impact than balance over five years. • from the article….“These results suggest that fans may not prefer competitive balance in a given season, but over time, the slogan ‘wait till next year’ must remain valid for the teams located toward the bottom of the standings”
more Schmidt and Berri (2001) • from The Wages of Wins… • The largest impact was seen when we looked at improvements in our five-year measure. A movement from the least competitive five-year measure to the highest level of balance would result in about 3,500 additional fans per game for each team. This works out to a 14% increase in attendance. Again, this was the largest impact we found. So a very large change in competitive balance across the longest time period we considered, and 14% is all the “oomph” we uncover.
How does competitive balance impact league demand? According to Humphreys (2002)… • from The Wages of Wins… • Humphreys looked at three measures of competitive balance, the Noll-Scully, the Herfindahl-Hirschman Index, and Humphrey’s Competitive Balance Ratio (CBR). • Humphreys (2002) defines the CBR as follows: “The CBR scales the average time variation in won-loss percentage for teams in the league by the average variation in won-loss percentages across seasons; it indicates the relative magnitude of each type of variation across a number of seasons” (p. 137). • In a model designed to explain league attendance Humphreys found that only the CBR was statistically significant. • Although Humphreys does not address this issue, his results suggest that a movement from the lowest observed level of balance to the highest would increase a team’s attendance by 4,000 fans per game. Again, that is quite similar to what we found with the Gini Coefficient.
Competitive Balance Lessons: from The Wages of Wins • The measurement of competitive balance should focus on outcome in the regular season, not the post-season. • Relative to its history, baseball is more balanced today. • Relative to sports like football and soccer, baseball is not as balanced. Compared to basketball, though, baseball does not have a competitive balance problem. • Competitive balance appears to be dictated primarily by the underlying population of talent, not league policy. • Although we can find a statistical relationship between competitive balance and attendance, the estimated economic significance seems quite small. Consequently, it is not clear whether the fans truly care about the level of balance in a league. • The relationship between team revenue and wins suggests that perfect competitive balance would actually lower league revenues.