Download
1 / 63
630 likes | 805 Views
MGMT 276: Statistical Inference in Management Winter, 2013. Welcome. http://www.youtube.com/watch?v=Ahg6qcgoay4&watch_response. Please start portfolios. Evaluations. Thank you!. Homework Assignment #13 due - Monday (January 13 th ) . On class website:

E N D
MGMT 276: Statistical Inference in ManagementWinter, 2013 Welcome http://www.youtube.com/watch?v=Ahg6qcgoay4&watch_response
Please start portfolios
Evaluations Thank you!
Homework Assignment #13 due - Monday (January 13th) On class website: Please print and complete homework worksheet Multiple Regression Please click in My last name starts with a letter somewhere between A. A – D B. E – L C. M – R D. S – Z Please double check – All cell phones other electronic devices are turned off and stowed away
Readings: (Before the next exam – January 13th) Lind Chapter 10: One sample Tests of Hypothesis Chapter 11: Two sample Tests of Hypothesis Chapter 12: Analysis of Variance Chapter 13: Linear Regression and Correlation Chapter 14: Multiple Regression Chapter 15: Chi-Square Plous Chapter 2: Cognitive Dissonance Chapter 3: Memory and Hindsight Bias Chapter 4: Context Dependence Chapter 17: Social Influences Chapter 18: Group Judgments and Decisions
Some useful terms • Regression uses the predictor variable (independent) to make predictions about the predicted variable (dependent) • Coefficient of correlation is name for “r” • Coefficient of determination is name for “r2”(remember it is always positive – no direction info) • Standard error of the estimate is our measure of the variability of the dots around the regression line(average deviation of each data point from the regression line – like standard deviation)
Writing Assignment - 5 Questions 1. What is regression used for? • Include and example 2. What is a residual? How would you find it? 3. What is Standard Error of the Estimate (How is it related to residuals?) 4. Give one fact about r2 5. How is regression line like a mean? r2
Correlation - the prediction line - what is it good for? Prediction line • makes the relationship easier to see • (even if specific observations - dots - are removed) • identifies the center of the cluster of (paired) observations • identifies the central tendency of the relationship(kind of like a mean) • can be used for prediction • should be drawn to provide a “best fit” for the data r2 • should be drawn to provide maximum predictive (explanatory) power for the data • should be drawn to provide minimum predictive error
Multiple regression equations Dependent Variable Independent Variable What are we predicting? • Can use variables to predict • behavior of stock market • probability of accident • amount of pollution in a particular well • quality of a wine for a particular year • which candidates will make best workers
YearlyIncome Expenses per year Multiple regression will use multiple independent variables to predict the single dependent variable You probably make this much The predicted variable goes on the “Y” axis and is called the dependent variable. The predictor variable goes on the “X” axis and is called the independent variable You probably make this much Dependent Variable (Predicted) If you spend this much If you save this much Independent Variable 1 (Predictor) If you spend this much Independent Variable 2 (Predictor)
Multiple regression equations 1 How many independent variables? How many dependent variables? Prediction line Y’ = b1X 1+ b0 • We can predict amount of crime in a city from • the number of bathrooms in city Prediction line Y’ = b1X 1+ b2X 2+ b0 • We can predict amount of crime in a city from • the number of bathrooms in city • the amount spent on education in city 3 How many independent variables? 1 How many dependent variables? Prediction line Y’ = b1X 1+ b2X 2+ b3X 3+ b0 • We can predict amount of crime in a city from • the number of bathrooms in city • the amount spent on education in city • the amount spent on after-school programs
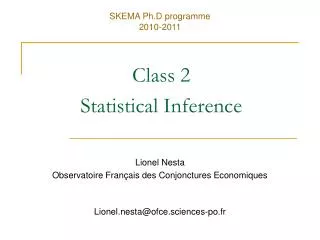
Multiple regression • Used to describe the relationship between several independent variables and a dependent variable. Can we predict amount of crime in a city from the number of bathrooms and the amount of spent on education and on after-school programs? Prediction line Y’ = b1X 1+ b2X 2+ b3X 3+ b0 • X1 X2 and X3are the independent variables. • Y is the dependent variable (amount of crime) • b0is the Y-intercept • b1is the net change in Y for each unit change in X1 holding X2and X3 constant. It is called a regressioncoefficient.
Regression Plane for a 2-Independent Variable Linear Regression Equation
Can use variables to predict which candidates will make best workers • Measured current workers – the best workers tend to have highest “success scores”. (Success scores range from 1 – 1,000) • Try to predict which applicants will have the highest success score. • We have found that these variables predict success: • Age (X1) • Niceness (X2) • Harshness (X3) Both 10 point scales Niceness (10 = really nice) Harshness (10 = really harsh) According to your research, age has only a small effect on success, while workers’ attitude has a big effect. Turns out, the best workers have high “niceness” scores and low “harshness” scores. Your results are summarized by this regression formula: Y’ = b1X 1+ b2X 2+ b3X 3 + a Y’ = b1 X1 + b2 X2 + b3 X 3 + a Success score = (1)(Age) + (20)(Nice) + (-75)(Harsh) + 700
According to your research, age has only a small effect on success, while workers’ attitude has a big effect. Turns out, the best workers have high “niceness” scores and low “harshness” scores. Your results are summarized by this regression formula: Y’ = b1 X1 + b2 X2 + b3 X 3 + a Success score = (1)(Age) + (20)(Nice) + (-75)(Harsh) + 700
According to your research, age has only a small effect on success, while workers’ attitude has a big effect. Turns out, the best workers have high “niceness” scores and low “harshness” scores. Your results are summarized by this regression formula: Y’ = b1 X1 + b2 X2 + b3 X 3 + a Success score = (1)(Age) + (20)(Nice) + (-75)(Harsh) + 700 • Y’ is the dependent variable • “Success score” is your dependent variable. • X1 X2 and X3are the independent variables • “Age”, “Niceness” and “Harshness” are the independent variables. • Each “b” is called a regression coefficient. • Each “b” shows the change in Y for each unit change in its own X (holding the other independent variables constant). • a is the Y-intercept
Y’ = b1X 1 + b2X 2 + b3X 3+ a The Multiple Regression Equation – Interpreting the Regression Coefficients Success score = (1)(Age) + (20)(Nice) + (-75)(Harsh) + 700 b1 = The regression coefficient for age (X1) is “1” The coefficient is positive and suggests a positive correlation between age and success. As the age increases the success score increases. The numeric value of the regression coefficient provides more information. If age increases by 1 year and hold the other two independent variables constant, we can predict a 1 point increase in the success score.
Y’ = b1X 1 + b2X 2 + b3X 3+ a The Multiple Regression Equation – Interpreting the Regression Coefficients Success score = (1)(Age) + (20)(Nice) + (-75)(Harsh) + 700 b2 = The regression coefficient for age (X2) is “20” The coefficient is positive and suggests a positive correlation between niceness and success. As the niceness increases the success score increases. The numeric value of the regression coefficient provides more information. If the “niceness score” increases by one, and hold the other two independent variables constant, we can predict a 20 point increase in the success score.
Y’ = b1X 1 + b2X 2 + b3X 3+ a The Multiple Regression Equation – Interpreting the Regression Coefficients Success score = (1)(Age) + (20)(Nice) + (-75)(Harsh) + 700 b3 = The regression coefficient for age (X3) is “-75” The coefficient is negative and suggests a negative correlation between harshness and success. As the harshness increases the success score decreases. The numeric value of the regression coefficient provides more information. If the “harshness score” increases by one, and hold the other two independent variables constant, we can predict a 75 point decrease in the success score.
Here comes Victoria, her scores are as follows: Prediction line: Y’ = b1X 1+ b2X 2+ b3X 3+ a Y’ = 1X 1+ 20X 2- 75X 3+ 700 Y' = (1)(Age) + (20)(Nice) + (-75)(Harsh) + 700 • Age = 30 • Niceness = 8 • Harshness= 2 Y' = (1)(Age) + (20)(Nice) + (-75)(Harsh) + 700 What would we predict her “success index” to be? Y' = (1)(Age) + (20)(Nice) + (-75)(Harsh) + 700 We predict Victoria will have a Success Index of 740 (1)(30) - 75(2) + (20)(8) + 700 Y’ = = 3.812 Y’ = 740 Y' = (1)(Age) + (20)(Nice) + (-75)(Harsh) + 700
Here comes Victoria, her scores are as follows: Prediction line: Y’ = b1X 1+ b2X 2+ b3X 3+ a Y’ = 1X 1+ 20X 2- 75X 3+ 700 Y' = (1)(Age) + (20)(Nice) + (-75)(Harsh) + 700 • Age = 30 • Niceness = 8 • Harshness= 2 Y' = (1)(Age) + (20)(Nice) + (-75)(Harsh) + 700 What would we predict her “success index” to be? Y' = (1)(Age) + (20)(Nice) + (-75)(Harsh) + 700 We predict Victoria will have a Success Index of 740 (1)(30) - 75(2) Y’ = + (20)(8) + 700 = 3.812 Y’ = 740 Here comes Victor, his scores are as follows: We predict Victor will have a Success Index of 175 • Age = 35 • Niceness = 2 • Harshness= 8 What would we predict his “success index” to be? Y' = (1)(Age) + (20)(Nice) + (-75)(Harsh) + 700 (1)(35) - 75(8) + (20)(2) + 700 Y’ = Y’ = 175
Can use variables to predict which candidates will make best workers We predict Victor will have a Success Index of 175 We predict Victoria will have a Success Index of 740 Who will we hire?
Multiple Linear Regression - Example Can we predict heating cost? Three variables are thought to relate to the heating costs: (1) the mean daily outside temperature, (2) the number of inches of insulation in the attic, and (3) the age in years of the furnace. To investigate, Salisbury's research department selected a random sample of 20 recently sold homes. It determined the cost to heat each home last January
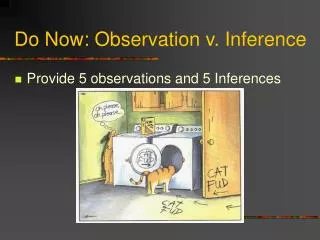
The Multiple Regression Equation – Interpreting the Regression Coefficients b1 = The regression coefficient for mean outside temperature (X1) is -4.583. The coefficient is negative and shows a negative correlation between heating cost and temperature. As the outside temperature increases, the cost to heat the home decreases. The numeric value of the regression coefficient provides more information. If we increase temperature by 1 degree and hold the other two independent variables constant, we can estimate a decrease of $4.583 in monthly heating cost.
The Multiple Regression Equation – Interpreting the Regression Coefficients b2 = The regression coefficient for mean attic insulation (X2) is -14.831. The coefficient is negative and shows a negative correlation between heating cost and insulation. The more insulation in the attic, the less the cost to heat the home. So the negative sign for this coefficient is logical. For each additional inch of insulation, we expect the cost to heat the home to decline $14.83 per month, regardless of the outside temperature or the age of the furnace.
The Multiple Regression Equation – Interpreting the Regression Coefficients b3 = The regression coefficient for mean attic insulation (X3) is 6.101 The coefficient is positive and shows a negative correlation between heating cost and insulation. As the age of the furnace goes up, the cost to heat the home increases. Specifically, for each additional year older the furnace is, we expect the cost to increase $6.10 per month.
Applying the Model for Estimation What is the estimated heating cost for a home if: • the mean outside temperature is 30 degrees, • there are 5 inches of insulation in the attic, and • the furnace is 10 years old?
Multiple regression equations Very often we want to select students or employees who have the highest probability of success in our school or company. Andy is an administrator at a paralegal program and he wants to predict the Grade Point Average (GPA) for the incoming class. He thinks these independent variables will be helpful in predicting GPA. • High School GPA (X1) • SAT - Verbal (X2) • SAT - Mathematical (X3) Andy completes a multiple regression analysis and comes up with this regression equation: Prediction line Y’ = b1X 1+ b2X 2+ b3X 3+ a Y’ = 1.2X 1+ .00163X 2- .00194X 3 - .411 Y’ = 1.2 gpa + .00163satverb - .00194satmath - .411
Here comes Victoria, her scores are as follows: Prediction line: Y’ = b1X 1+ b2X 2+ b3X 3+ a Y’ = 1.2X 1+ .00163X 2-.00194X 3 - .411 • High School GPA = 3.81 • SATVerbal = 500 • SATMathematical = 600 What would we predict her GPA to be in the paralegal program? Y’ = 1.2 gpa + .00163satverb - .00194satmath - .411 Y’ = 1.2 (3.81)+ .00163(500)- .00194 (600)- .411 We predict Victoria will have a GPA of 3.812 Y’ = 4.572 + .815 - 1.164 - .411 = 3.812 Predict Victor’s GPA, his scores are as follows: We predict Victor will have a GPA of 2.656 • High School GPA = 2.63 • SAT - Verbal = 469 • SAT - Mathematical = 440 Y’ = 1.2 gpa + .00163satverb - .00194 satmath - .411 Y’ = 1.2 (2.63)+ .00163(469)- .00194 (440)- .411 = 2.66 Y’ = 3.156 + .76447 - .8536 - .411
500 400 300 200 100 500 400 300 200 100 500 400 300 200 100 Heating Cost Heating Cost Heating Cost 0 20 40 60 80 0 20 40 60 80 0 20 40 60 80 Average Temperature Insulation Age of Furnace r(18) = - 0.50 r(18) = - 0.40 r(18) = + 0.60 r(18) = - 0.811508835 r(18) = - 0.257101335 r(18) = + 0.536727562
500 400 300 200 100 500 400 300 200 100 500 400 300 200 100 Heating Cost Heating Cost Heating Cost 0 20 40 60 80 0 20 40 60 80 0 20 40 60 80 Average Temperature Insulation Age of Furnace r(18) = - 0.50 r(18) = - 0.40 r(18) = + 0.60 r(18) = - 0.811508835 r(18) = - 0.257101335 r(18) = + 0.536727562
+ 427.19 - 4.5827 -14.8308 + 6.1010 - 4.5827 x1 - 14.8308 x2 427.19 + 6.1010 x3 Y’ =
+ 427.19 - 4.5827 -14.8308 + 6.1010 - 4.5827 x1 - 14.8308 x2 427.19 + 6.1010 x3 Y’ =
+ 427.19 - 4.5827 -14.8308 + 6.1010 - 4.5827 x1 - 14.8308 x2 427.19 + 6.1010 x3 Y’ =
+ 427.19 - 4.5827 -14.8308 + 6.1010 - 4.5827 x1 - 14.8308 x2 427.19 + 6.1010 x3 Y’ =
+ 427.19 - 4.5827 -14.8308 + 6.1010 - 4.5827 x1 - 14.8308 x2 427.19 + 6.1010 x3 Y’ =
4.58 14.83 6.10 - 4.5827(30) +6.1010 (10) -14.8308 (5) 427.19 Y’ = + 61.010 - 74.154 - 137.481 = $ 276.56 = $ 276.56 427.19 Y’ = Calculate the predicted heating cost using the new value for the age of the furnace Use the regression coefficient for the furnace ($6.10), to estimate the change
4.58 14.83 6.10 - 4.5827(30) +6.1010 (10) -14.8308 (5) 427.19 Y’ = + 61.010 - 74.154 - 137.481 = $ 276.56 427.19 Y’ = - 4.5827(30) +6.1010 (10) -14.8308 (5) 427.19 Y’ = These differ by only one year but heating cost changed by $6.10 282.66 – 276.56 = 6.10 + 61.010 - 74.154 - 137.481 = $ 276.56 = $ 276.56 427.19 Y’ = $ 276.56 - 4.5827(30) +6.1010 (11) -14.8308 (5) 427.19 Y’ = + 67.111 - 74.154 - 137.481 = $ 282.66 427.19 Y’ = Calculate the predicted heating cost using the new value for the age of the furnace Use the regression coefficient for the furnace ($6.10), to estimate the change
4.0 3.0 2.0 1.0 4.0 3.0 2.0 1.0 4.0 3.0 2.0 1.0 GPA GPA GPA 0 200 300 400 500 600 0 1 2 3 4 0 200 300 400 500 600 High School GPA SAT (Verbal) SAT (Mathematical) r(7) = 0.50 r(7) = + 0.80 r(7) = + 0.80 r(7) = + 0.911444123 r(7) = + 0.616334867 r(7) = + 0.487295007
4.0 3.0 2.0 1.0 4.0 3.0 2.0 1.0 4.0 3.0 2.0 1.0 GPA GPA GPA 0 200 300 400 500 600 0 1 2 3 4 0 200 300 400 500 600 High School GPA SAT (Verbal) SAT (Mathematical) r(7) = 0.50 r(7) = + 0.80 r(7) = + 0.80 r(7) = + 0.911444123 r(7) = + 0.616334867 r(7) = + 0.487295007
4.0 3.0 2.0 1.0 4.0 3.0 2.0 1.0 4.0 3.0 2.0 1.0 GPA GPA GPA 0 200 300 400 500 600 0 1 2 3 4 0 200 300 400 500 600 High School GPA SAT (Verbal) SAT (Mathematical) r(7) = 0.50 r(7) = + 0.80 r(7) = + 0.80 r(7) = + 0.911444123 r(7) = + 0.616334867 r(7) = + 0.487295007
4.0 3.0 2.0 1.0 4.0 3.0 2.0 1.0 4.0 3.0 2.0 1.0 GPA GPA GPA 0 200 300 400 500 600 0 1 2 3 4 0 200 300 400 500 600 High School GPA SAT (Verbal) SAT (Mathematical) r(7) = 0.50 r(7) = + 0.80 r(7) = + 0.80 r(7) = + 0.911444123 r(7) = + 0.616334867 r(7) = + 0.487295007