Download
1 / 38
400 likes | 631 Views
Participatory Mapping of Urban Poverty. Allan Cain DEVELOPMENT WORKSHOP Presented to the China – Africa Urban Exchange on Pro Poor Urban Development 30 - 31 July 2012 Nairobi - Kenya. Millenium Development Goals. The overall aim of the MDGs was to reduce poverty by one half by 2015

E N D
Participatory Mapping of Urban Poverty Allan Cain DEVELOPMENT WORKSHOP Presented to the China – Africa Urban Exchange on Pro Poor Urban Development 30 - 31 July 2012 Nairobi - Kenya
Millenium Development Goals • The overall aim of the MDGs was to reduce poverty by one half by 2015 • MDGs were defined and mapped out for each sector • Member governments of the UN made commitments to meet the Millennium Development Goals • Each member country of the United Nations made the commitment to measure their progress to meeting these targets. • Indicators were defined in order to accurately measure the progress made, year-by-year towards meeting these goals SISTEMA NACIONAL DE INFORMAÇÃO TERRITORIAL
Measuring Urban Poverty Reduction • UN Habitat established a Global Urban Observatory Program to help countries monitor their progress to meeting the key urban MDGs as articulated in Goal 7 indicators 11. • The aim of the Urban MDGs is to reduce the proportion of populations living is slums by measuring the following indicators: • Acess to an adequate potable water supply • Acess to improved sanitation • Sufficient living space • Durable and safe housing • Secure land tenure SISTEMA NACIONAL DE INFORMAÇÃO TERRITORIAL
China & Africa Urban & Economic Growth SISTEMA NACIONAL DE INFORMAÇÃO TERRITORIAL
Africa & Asia Urban Poverty Reduction SISTEMA NACIONAL DE INFORMAÇÃO TERRITORIAL
Reduction of Slums between 1990 & 2010 1990 2010
Reduction of Slums between 1990 - 2010 SISTEMA NACIONAL DE INFORMAÇÃO TERRITORIAL
Economic Exclusion & Gini Coefficients The Gini coefficient measures the inequality of wealth within a group such as a city. A Gini coefficient of ‘zero’ expresses perfect equality while ‘one’ expresses maximal inequality
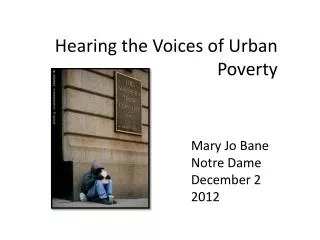
Who benefits from urban growth? How do women fare? SISTEMA NACIONAL DE INFORMAÇÃO TERRITORIAL
Local Urban Poverty Observatories The purpose of the observatory is to monitor key urban indicators and ensure that the information is used to inform policies, public institutions and local policy-makers National and local observatories also involve representatives from civil society, private sector and academic institutions. SISTEMA NACIONAL DE INFORMAÇÃO TERRITORIAL
Local Observatories • Most of the observatories adopt a multi-sectoral approach, collecting and analyzing urban/national indicators • Consultative processes involve a wide range of actors and institutions that identify these priorities • Sensitize stakeholders to urban issues that are collectively agreed-upon by using indicators and urban data processed in easy-to-understand formats, such as maps and visual aids • Use of geo-referenced information and statistical information to promote broad public access to that information. • GIS experts are essential to process data to integrate spatial analysis. SISTEMA NACIONAL DE INFORMAÇÃO TERRITORIAL
Monitoring Methodology/Approaches Baseline Indicators: slum locations, size, services, housing conditions (using 1990 data) Policies: relocation or upgrading (site selection); infrastructure provisions (water, sanitation …); service provisions (health, education…); civic rights (land tenure, housing security); environmental protection (flooding, climate adaptation) Outcome Indicators: Measuring improvements improved coverage? or improved access (quantifiable and qualifiable) Validating information through participatory community monitoring
Voices of Citizens for Urban Change • To influence more inclusive municipal planning processes, and equitable access to improved urban services for the poor by: • promoting community participation in monitoring urban poverty indicators related to the Millennium Development Goals • providing evidence-based information as inputs into municipal plans; • Building an urban poverty network that advocates for equitable access to improved basic services and promote participatory governance; • increase sustainable access basic services by promoting community management models to ensure that consumer voices are heard. SISTEMA NACIONAL DE INFORMAÇÃO TERRITORIAL
Building Capacity & Ownership • local institutions were trained in participatory diagnostic tools • Multi-stakeholder teams were composed including technicians from the National Planning Institute (INOTU), civil society and local government to ensure the confidence and co-ownership of the data. • regular collection of information and monitoring of specific indicators at the local level to measure change. • the creation spaces for consultation and negotiation between communities, government and civil society institutions SISTEMA NACIONAL DE INFORMAÇÃO TERRITORIAL
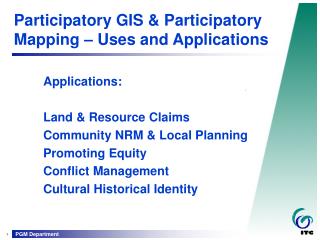
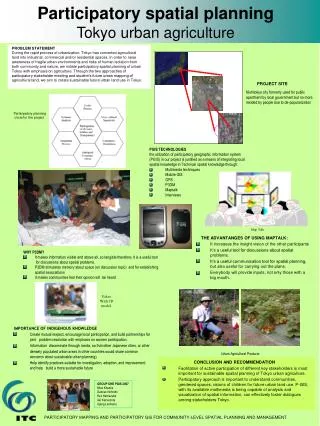
Geographic Information Systems Remote sensing: Applied GIS tools for collecting urban information, using aerial photographs and satellite images. Participatory Mapping SISTEMA NACIONAL DE INFORMAÇÃO TERRITORIAL
Participatory Research • Household surveys made by teams comprised of technicians from INOTU, university students and community groups, under the supervision and technical support of DW. • Data on MDGs was validated by interviews with key informants and focus groups in all bairros in Luanda. • Data mapped & put into the public domain. Provided to urban planners, ministries, municipal administrators, community associations. SISTEMA NACIONAL DE INFORMAÇÃO TERRITORIAL
Municipal Forums • monitoring results are presented to the Municipal Forums & CACs • strengthens the capacity of local authorities and civil society to ensure inclusive and participatory local development. • demonstrated spaces for consultation between local authorities and civil society on urban issues and promotes municipal democratisation. SISTEMA NACIONAL DE INFORMAÇÃO TERRITORIAL
Findings: Land Tenure • Most of poor families accumulated savings are tied up in the land they occupy and the house they built or purchase • Rapid development of informal markets for the purchase and renting of land and property • Formal titling is very rare, but levels of perceived tenure security is high • The majority of peri-urban residents acquired their and houses through informal mechanisms • and don't have access to mechanisms to regularize their land.
Mapping of Housing Quality & Durability Housing is considered durable if built in a non-hazardous location and has a structure permanent and adequate to protect the inhabitants of the weather such as rain, heat, cold and moisture. SISTEMA NACIONAL DE INFORMAÇÃO TERRITORIAL
Mapping of Environmental Risk Areas SISTEMA NACIONAL DE INFORMAÇÃO TERRITORIAL
Waste Water Drainage Domestic Solid Watse Removal
Composite poverty map of all MDG indicators SISTEMA NACIONAL DE INFORMAÇÃO TERRITORIAL
Urban Challenges 76% of Luanda’s population lives in informal Musseques
Luanda’s rapid urban growth in war and post-war years 1980 - 19,42 Km² 1989 - 100,80 Km² 1998 - 253,27 Km² 2000 - 270,05 Km² 2010 – 350,00 Km² CRESCIMENTO EXPANSIVO Development Workshop Angola
Financing urban development Large-scale investment is needed in bulk provision, such as mains water supply and treatment, final rubbish disposal sites and mains sewerage. Financing urban development in a situation such as Luanda, which has a low fiscal base, is a severe challenge. This is due partly to the poverty of the majority of the inhabitants. The weak taxation regime in general partly due to a lack of up-to-date cadastre and population census. Financing is required at a scale that even the state cannot afford. Partnerships with private sector and international lenders are necessary. China has been the principal financer of Angolan reconstruction.
Background on Angola & China Angola is China’s principal African trading partner 25% of China’s African commerce is with Angola 15% of China’s petroleum imports are from Angola Angola and China are two of the fastest urbanising countries in the world. At 7% growth Luanda is the fastest growing city in Southern Africa. Much of Angola’s post-war reconstruction is financed by Chinese credit lines. Chinese – Angolan economic cooperation is estimated to be about US$ 25 billion over the last decade.
Chinese Economic Cooperation Contracts of Chinese Companies in Angola (2003 – 2009), US$ millions
Angola’s Poverty Reduction Strategy The Angolan Government has adopted four strategies that could have significant impacts on reducing urban poverty: Water for All aims to bring an adequate and affordable supply of water to 80% of peri-urban and rural families by the end of 2012. One million house programme aims to deliver social housing to the homeless by 2012. Decentralisation and fiscal deconcentration aims to have democratically elected municipal councils after 2012. Commitment to the Millennium Development Goals to reduce poverty by 50% by 2015.
Obrigado SISTEMA NACIONAL DE INFORMAÇÃO TERRITORIAL