Download
1 / 25
260 likes | 437 Views
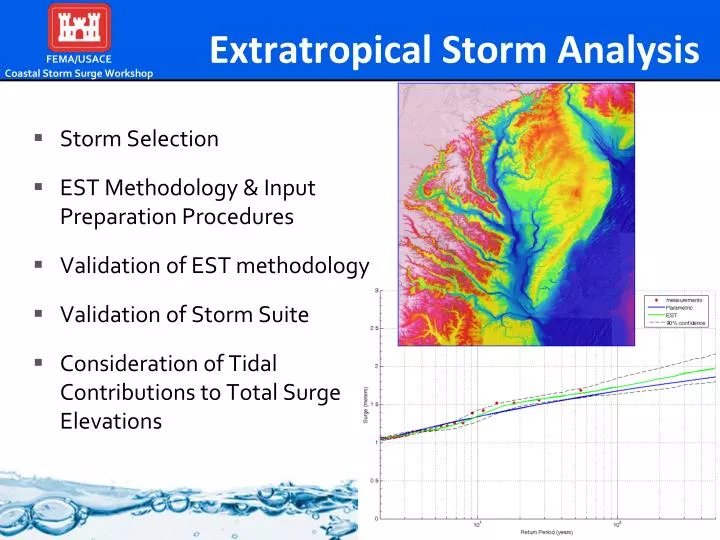
Extratropical Storm Analysis. Storm Selection EST Methodology & Input Preparation Procedures Validation of EST methodology Validation of Storm Suite Consideration of Tidal Contributions to Total Surge Elevations. Storm Selection.

E N D
Extratropical Storm Analysis Storm Selection EST Methodology & Input Preparation Procedures Validation of EST methodology Validation of Storm Suite Consideration of Tidal Contributions to Total Surge Elevations
Storm Selection • Storms based on historical water level events measured at National Ocean Station measurement locations • Only stations with long continuous measurements are considered • Same methodology applied in FEMA NC study NOS Stations with a minimum of 15-years of data in the study domain
Storm Selection • Residual water levels (measured-predicted tide) were computed to select storms based on surge rather than tide • Individual stations with gaps in the historical record were removed to avoid bias in the selection process Historical residual water level measurements at Chesapeake City, MD – NOS Station 8573927
Storm Selection Seven NOS stations representing the period of Jan-26-1975 to Aug-31-2008
Storm Selection • Individual peaks at each station were identified above the 99th percentile threshold • Multiple peaks within a 3-day period considered within the same storm • Events were ranked individually by station • Events from tropical systems identified and removed • 30 storm events identified from event list
Storm Selection • Three NOS stations with shorter records (1998-2003) used to check storm list in data void regions • Selected storm list represents top 4 of 5, 3 of 5 and 3 of 5 events within each of the station’s period of measurement
EST Methodology The EST is a statistical procedure for simulating lifecycle time sequences of nondeterministic multiparameter systems. Any natural process for which some temporal cycle can be assign is a candidate application of the EST. The EST utilizes observed and/or computed parameters associated with site-specific historical events as a basis for developing a methodology for generating multiple lifecycle simulation of storm activity and the effects associated with each simulated event. Contrary to the JPM, the technique does not rely on assumed parametric relationships but uses the joint probability relationships inherent in the local database.
EST Methodology Based on a “Bootstrap” resampling-with-replacement, interpolation, and subsequent smoothing technique in which a random sampling of a finite length database is used to generate a larger database. Key assumption is that future storms will be statistically similar in magnitude and frequency to past events. The input database (training set) is parameterized to define the characteristics of each event and the impacts of that event. Parameters that define the storm are referred to as input vectors. Response vectors define storm-related impacts. The input and response vectors are used as a basis for generating lifecycle simulations of storm-event activity.
EST – Data preparation For the FEMA Region III study a uni-variant analyses was performed (single input vector/single response vector). The input vector was the observed or modeled peak water surface elevation. The tidal contribution was removed from the observations by subtracting the predicted tide amplitude. The response vector was the observed or modeled peak water surface elevation. The input and response vectors enter into the EST routine through the “Reach.estin” ASCII input file.
EST – Data preparation EST input file hbootin.dat • The EST model input parameters include: • Number of storms in training set (30/90). • Average number of storms per year (0.88235). • Length of simulation in years (500). • Number of simulations (1000).
EST – Validation of Methodology An EST analysis was performed on the long-term measurements at 7 stations and compared and the resulting stage-frequency relationships were compared to the GPD parametric analysis technique:
EST – Validation Storm Suite An EST analysis was performed on the selected storm suite measurements and compared to the long-term measurements:
EST – Validation Storm Suite(modeling) An EST analysis was performed on the modeled selected storm suite and compared to the long-term measurements:
EST – Tide Contribution The tide contribution to total water surface elevations was accounted for by expanding the training set of storms input to EST. Assumes extratropical storms are of sufficient duration that high tide will occur during the event. Peak storm surge was increased by the high tide amplitude corresponding to mean, neap, and spring tidal ranges. Introduced relative weighting of 2 for storms associated with mean high tides, storms associated with neap and spring high tide were given a weight of 1.
Extratropical Storm Analysis Questions ?