Download
1 / 26
260 likes | 424 Views
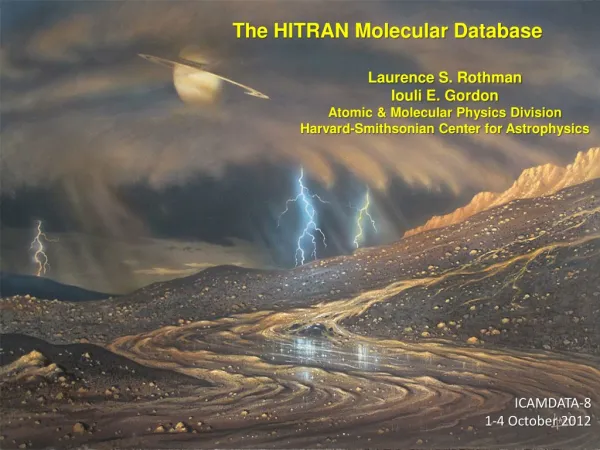
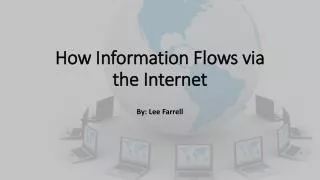
The 11th HITRAN Database Conference June 16 – June 18, 2010. Information System to Access HITRAN via the Internet. Yu. L. Babikov , S. N. Mikhailenko, S. A. Tashkun, V.E. Zuev Institute of Atmospheric Optics, Tomsk, Russia . I. E. Gordon, L. S. Rothman

E N D
The 11th HITRAN Database Conference June 16 – June 18, 2010 Information System to Access HITRAN via the Internet Yu. L. Babikov, S. N. Mikhailenko, S. A. Tashkun, V.E. Zuev Institute of Atmospheric Optics, Tomsk, Russia. I. E. Gordon, L. S. Rothman Harvard-Smitsonian Center for Astrophysics, Cambridge, MA USA
Prototype system: SPECTRA • Development started in 2000 • Present shape was fixed in 2004-2005 • After that: some minor modifications, bug correction, • maintenance of database actual state • Internet site: http://spectra.iao.ru • SPECTRA system was presented in the previous HITRAN conference: S. Mikhailenko, Yu.Babikov, Vl.Golovko, S. Tashkun, SPECTRA, an Internet accessible information system for spectroscopy of atmospheric gases // 10th HITRAN Database Conference, Cambridge, MA, USA, June 22-24, 2008, Poster PI-13
Some history • 2007. Dr. Rothman suggested to start a collaboration. • In frames of this collaboration he suggested to develop an Internet information system, like SPECTRA to access to HITRAN databank. • 2008. The project «Fundamental spectroscopic system for climate change monitoring» was initiated. • 2009. Project was supported by CRDF (RUG1-2954-TO-09) and RFBR (09-05-92508) joint grant.
Hitran on the Web: Database. As a data storage used relational database managed by MySQL DBMS. This database consists of 4 parts: • main database (Molecules, Isotopologues, Vibrational states, Transitions, Line lists, Gas mixtures, Partition functions and so on); • auxiliary database (Users, News, Bibliography ...); • user's database for user defined data; • temporary database for temporary tables created by the system while processing of user's requests.
Hitran on the Web: Functionality. All users (unregistered and registered)may: • Survey of the HITRAN database content for a specified spectral range • Specify a set of vibrational bands for a given HITRAN isotopologue for a selected wavenumber region • Specify a gas mixture from a set of built-in standard atmospheric concentration profiles for a selected wavenumber region • Visualize stick intensity diagram of the specified mixture • Simulate one of built-in spectral functions (absorption coefficient profile, transmittance, absorption, or radiance) of the mixture spectrum convolved with one of built-in apparatus function for various physical (temperature, pressure, pathlength) and simulation (intensity cutoff, contour shape, wing length, resolution, etc) conditions Registered users may also: • Prepare user defined gas mixtures • Save simulation results on the server side and compare them • Upload spectra to the server side and compare them with previously simulated spectra
Survey of available isotopologues and transitions for a selected molecule
Simulation of Absorption coefficient for the diagram shown above
Gas mixture spectrum. Transmittance function for the stick diagram shown above.
Future work • Implement algorithms for fast calculation of absorption coefficients (Boris Fomin) • Expand the set of supported line shapes • Implement additional options to work with the user defined data • Fill of a database of bibliographic references and expand possibilities of work with the bibliography • Create the help system: well structured and detailed • Re-release the plotting software on the base of the Protochart JavaScript: include interactive drag-and-drop, zoom options and so on. • The current version of the system available via the Internet for testing purposes: http://hitran.iao.ru
Acknowledgements We acknowledge support from a joint RFBR (09-05-92508-ИК_а) and CRDF (RUG1-2954-TO-09) grant. Thank you for attention!