Download

1 / 30
300 likes | 418 Views
The Underpinnings of Land-Use History. Three Centuries of Global Gridded Land-use Transitions Wood Harvest Activity, and Resulting Secondary Lands. G.C. Hurtt, S. Frolking, M.G. Fearon, B. Moore III. E. Shevliakova, S. Malyshev, S.W. Pacala, R.A. Houghton. Princeton University. Woods Hole

E N D
The Underpinnings of Land-Use History Three Centuries of Global Gridded Land-use Transitions Wood Harvest Activity, and Resulting Secondary Lands G.C. Hurtt, S. Frolking, M.G. Fearon, B. Moore III E. Shevliakova, S. Malyshev, S.W. Pacala, R.A. Houghton Princeton University Woods Hole Research Ctr.
The Global Scale of Human Activities • The concentrations of several greenhouse gases have substantially increased in the atmosphere.1 • Anthropogenic N fixation now exceeds natural N fixation.2 • More than 50% of available freshwater is appropriated for human purposes.3 • Approx. 65% of marine fish stocks are fully exploited, or over exploited.4 • We are now in the 6th great extinction event.5 (1) IPCC 2001 (2) Kaiser 2001 (3) Postel et al 1996 (4) FAO 2000 (5) Lawton and May 1995; Pimm et al 1995. See also Steffen et al. 2003.
Land-use • Nearly 50% of the land surface has been transformed by direct human action.1 • > 25% of forests have been cleared.2 • Habitat destruction is the primary risk for species extinctions.3 • Land-cover change affects regional and global climate.4 • Land-use change is an important and highly uncertain term in the global carbon budget.5 • Net re-growth on recovering “secondary” lands is the dominant carbon sink mechanism in some regions.6 (1) Vitousek et al 1986; Turner eet al 1990; Daily 1995 (2) Waring & Running 1998. (3) UNEP 2002; Sala et al 2000; (4) Pielke et al. 2002; Roy et al 2004 (5) IPCC 2001. (6) Caspersen et al., 2000; Pacala et al 2001; Hurtt et al, 2002. See also Steffen et al 2003.
Understanding the Consequences of Land-use Activities • Patterns of land-use • Biogeochemistry on managed lands • Management practices • Fate of agricultural products • Land-use transitions • Earth System interactions
Key Questions • What are the patterns of the land-use transition events that produced the patterns of agriculture and logged forests? • What are the spatial patterns and age of lands recovering from prior land-use activities? • What is the net effect of land-use change events that release carbon, and the carbon sinks provided by recovering “secondary” lands?
The Mathematical Structure of aLand-use History Reconstruction l(x,y,t+1) = A(x,y,t)l(x,y,t) a11 a12 a13… a21 a22 a23… a31 a32 a33… … … l1 l2 l3 … l1 l2 l3 … latitude t+1 t time longitude Global, 1deg, 300 y, 4D: ~93x106 unknowns!
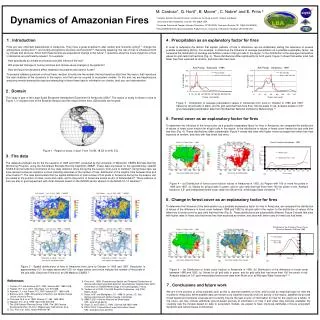
INPUT MODEL OUTPUT gridded (1°x1°) land-use states 1700-2000 • residency time of agriculture • • inclusiveness of wood harvest statistics • • prioritization of land for conversion/logging • • spatial pattern of wood harvesting within countries gridded (1°x1°) land-use transitions 1700-2000 gridded (1°x1°) potential biomass density and recovery rate gridded (1°x1°) secondary land area and age 1700-2000 national annual wood harvest 1700-2000
a) b) c) d)
a FAO (1988) total values do not include all countries, but are estimated to be within <10% of FAO • total global forest area. • b Ranges from data-based runs.
Additional Results • Estimates of wood harvest including slash (1850-1990) • This Study: 100 Pg • Houghton (1999): 106 Pg • Estimates of wood clearing for agriculture (1850-1990) • This study: 105-158 Pg • Houghton (1999): 149 Pg • Area of forest land in shifting-cultivation fallow (2000) • This study: 4.56-6.19 x 10⁶ km2 • FAO: 4.42 x 10⁶ km2 • Rates of clearing land in shifting cultivation • This study: 0.48-0.65 x 10⁶ km2 y-1 • Rojstaczer et al. (2001): 0.6-0.09 x 10⁶ km2 y-1 • U.S. Forests • This study: Secondary 94-99% • This study: Mean age of Eastern forests 33-42y • FIA based estimate: Mean age of Eastern forests 38y
Key Findings • 42-68% of land surface was impacted by human land-use activities (agriculture + wood harvest) 1700-2000. • Total secondary land area increased 10-44 x 106 km2 during this period; about half is forested. • Wood harvesting and shifting cultivation generated 70-90% of secondary land; permanent agriculture changes generated the rest.
U.S. Forest Inventory Plots http://www.fia.fs.fed.us/
Cumulative Intensity 0 1.0 40 8 km Height (m) 1 km 0 0 100 25 m Intensity Lidar Remote Sensing of Vegetation Height
Multi-angle Imaging SpectroRadiometer (MISR) http://www-misr.jpl.nasa.gov
Global C Budget (PgC/y) IPCC, 2001
U.S. Net Carbon Flux From Land-use Changes Hurtt et al, 2002
Biomass kg C/m2 Undisturbed Fraction 1800 1900 2000 0 26 0 1 Shevliakova et al, Submitted
Summary/Conclusion • This study provides the first global gridded estimates of land-use transitions (land conversions), wood harvesting, and resulting secondary lands annually, for the period 1700-2000 • Major results are consistent with large sets of input data, and compare favorably to aggregated independent estimates. • To best refine these estimates, new efforts are needed to characterize vegetation structure globally using remote sensing and field data. • Additional future challenges include: understanding the dynamics on agriculture lands (including management), creating integrated models capable of tracking land-use activities and estimating their consequences, and developing consistent models of land-use in the future.