Download
1 / 12
120 likes | 126 Views
WP O6 - Carbon turnover at different depths. Hyyttiala main concluded remarks Kinetics of CO 2 well characterized : strong increasing from 1 to 4 days and slowing down of emission after 4 days Kinetics of CH 4 release not well characterized, depending on the site, the depth

E N D
WP O6 - Carbon turnover at different depths Hyyttiala main concluded remarks • Kinetics of CO2 well characterized : strong increasing from 1 to 4 days and slowing down of emission after 4 days • Kinetics of CH4 release not well characterized, depending on the site, the depth • In addition, emissions of CH4 were rather smaller in anaerobic conditions than in aerobic ones • CH4/CO2 ratios collected from laboratory incubations were very small, calling into question its use as a regeneration index
WORK PROGRAMME 1 : November 2003 sampling First set of data 1. Soluble N and C (ppm and stocks expressed as gL-1) 2. Microbial biomass (FE) N and C (same units as above) 3. Microbial activity (aerobiosis and anaerobiosis) C-CO2 and C-CH4 release at 20°C • Second set of data • 1. SIR Biomass (Control, Bacteria, Fungi, Archaea) • 2. Microbial activity (aerobiosis and anaerobiosis) • No glucose added, only inhibitors of the specific groups • As there was not enough material, we mixed depthes 3 & 4
Sites : A B C D E Carbon Microbial Biomass Microbial biomass µg C g-1 DP, decreased with depth * significant correlation between results expressed as ppm with those expressed as g L-1 (R2 > 0.88 for C and N) correlations not so good for soluble C-N in the peat (R2 about 0.5)
WORK PROGRAMME 1 : November 2003 samples • Set of variables interesting indicator research • 1. Soluble forms of C and N, microbial biomass, activities • Country, (site)* and depth effect • 2. More integrative parameters • - C mineralization rate = C production/ SOC • - Microbial Turnover = C production/Biomass C • at a global level and at main group level (Bacteria, Fungi, Archaea) • - Ratios • Aerobiosis/ Anaerobiosis ratio • Bacteria/Fungi, Archaea/Fungi * To test a site effect need of precisions for fitting correspondance between site ?
Some examples : Nitrogen Microbial Biomass Country and depth effects on « N microbial biomass » (Kruskal-Wallis non parametric test)
C Microbial Turnover (= Activity/Biomass) Country and depth effects (Kruskal-Wallis non parametric test)
- the amount of N in the biomass aerobiosis - the amount of N in the biomass in anaerobiosis Carbon Microbial Turnover would depend on :
BIOMASS in % of total B+F+A SIR BIOMASS ratios BACTERIA, FUNGI, ARCHAEA Kruskal-Wallis non parametric test
BACTERIA, FUNGI, ARCHAEA Kruskal-Wallis non parametric test Peatland level (Baupte) - Bacterial activity decreased with depth compared to that of fungi - Ratio higher in Eriophorum site compared to bare peat one
WORK PROGRAMMES 1 & 2 - field measurements finally started at the end of July after many breakdowns (GC, IRGA and so on) and events such as flooding, act of vandalism, … WORK PROGRAMME 3 - lab experiment correctly started at the mid of September first set of samples dispatched (München, Caen) - the 2nd harvest of peat columns : at the end of November
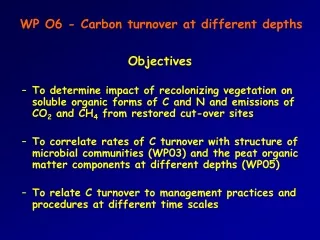
WP O6 - Carbon turnover at different depths Objectives • To determine impact of recolonizing vegetation on soluble organic forms of C and N and emissions of CO2 and CH4 from restored cut-over sites • To correlate rates of C turnover with structure of microbial communities (WP03) and the peat organic matter components at different depths (WP05) • To relate C turnover to management practices and procedures at different time scales