Download
1 / 40
400 likes | 479 Views
Understand the Score Reports and Use HSA Data for Planning and Improvement Purposes . Monica Mann Student Assessment Section. Two Outcomes. Increase understanding of the various HSA score reports Facilitate discussion on ways HSA data can and cannot be used. Reminders.

E N D
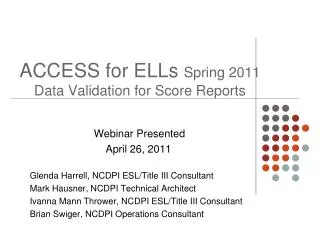
Understand the Score Reports and Use HSA Data for Planning and ImprovementPurposes Monica Mann Student Assessment Section
Two Outcomes • Increase understanding of the various HSA score reports • Facilitate discussion on ways HSA data can and cannot be used.
Reminders • Friday, August 29, 2008: Student score reports sent home Schools should also have: • CD of Family Reports at schools • School score reports • Data labels for each student (reading & math) September 1 – October 3, 2008: One-month score report verification request window
Verification • Questions regarding scores being assigned correctly to students or missing scores for specific student records. • Issues can be resolved by looking at data. There are four main categories of verifications: • Incorrect Score Assignment • Invalid Test Score Assignment • Missing Student/Report • Incorrect Demographic
Rescore • A request to pull a student response booklet and ensure that the appropriate score was given. The score is being questioned with the expectation that it will either receive a new score or an explanation as to why the original score was valid. • Requires booklet to be pulled.
4 Score Reports • Family Reports – Individual students • Class Reports - optional • School Reports • Complex Area Reports
Clear graphical presentation of scores allows parents to see at a glance if their children are meeting or not meeting the expectations. Describes performance standards in easy-to-understand language. Classifies students into proficiency bands for each content standard, avoiding numeric scores that invite misinterpretation. Describes what students can and cannot do in each skill area and offersconcrete recommendations based on the student’s performance.
Scale Score • Numbers set as a way of reporting test performance • 300 deemed “proficient” • Provides a range that translates to proficiency levels
Scale scores do not equate across grade levels
Proficiency Levels • Exceeds Proficiency • Meets Proficiency • Approaches Proficiency • Well Below Proficiency
Proficiency • Standards describe what students should know and be able to do at each grade level • Sets expectations as determined by “standard setting” committees comprised of teachers, administrators, parents and community members. • Levels adopted by the Board of Education.
What student progress looks like Both students are making good progress. Student blue meets the new expectations each year. Student green starts from behind, catches up, and continues to meet new expectations. Exceeds Meets Approaches Well Below Gr. 3 Gr. 4 Gr. 5 Gr. 6
Compares the school, complex area, and statewide scores, allowing the teacher to see how students in the class are performing compared to other students. A roster of students in the class displays overall performanceandperformance on each content strand. Charts by content strand help the teacher identify areas where students may need the most practice.
Cannot Track across grade levels as each grade level assesses different content.
Measurement in Gr. 6 & 7 • Estimate circumference and area of a circle • Construct angles • Apply strategies and formulas to solve area and perimeter problems involving polygons and complex shapes • Determine how measurements are affected when one of the attributes is changed in some way • Uses ratios and proportions to relate a scale drawing to the actual object • Use known measurements to calculate desired measurements of circles
The range of scale scores assigned to each proficiency level do not equate across grades= can’t compare.
Class Rosters Meets or Exceeds Proficiency: The student performance on the test met expectations in this content area. Expect that this student will be ready to learn challenging material that requires these skills and this knowledge. Near Proficiency: The student’s performance on the test was mixed. He or she may require extra support around this area. Begin the year by giving some assignments in class that will allow you to independently evaluate this student’s mastery of the expected skills in this content area. Does Not Meet Proficiency: The student performance on the test did not meet expectations in this content area. Be prepared to offer this student extra support as you teach material that requires these capabilities.
Similar Classes or Schools • Economically Disadvantaged • English Language Learners • Students with Disabilities
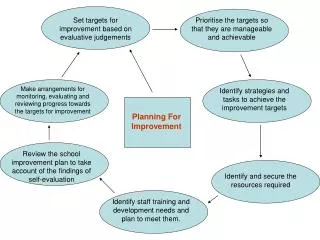
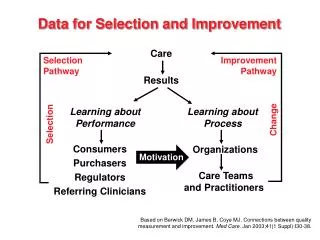
Reflective Tool How did my students perform based on my standards-based instruction and assessments? C,I,A
Patterns and Trends %age of Proficient Students in Gr. 5
Part of Diagnostic Tool Triangulation
Achievement is primarily a function of two things:(1) What we teach and (2) How we teachMike Schmoker“The Real Causes of Higher Achievement”
Performance by proficiency levelgraphs show the percentage of students in the school who are exceeding, meeting, approaching or falling below expectations. A roster of classes in the school gives an overall picture of how each class is performing. The coconut tree chart shows the performance of students in each demographic group, such as Asian students, students with disability, or disadvantaged students.
How did your students do • Compared to the rest of your complex area? • Compared to the rest of the state?
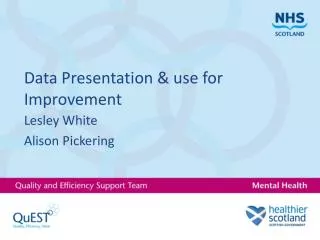
By Strands What are our school’s strengths and improvement areas? Implications
How are we doing as a school? What are the patterns and trends from various sources of data?
“Research has found… …that faculty in successful schools always question existing instructional practices and do not blame lack of student achievement on external causes … The “source of the problem” in ordinary schools is always someone else: the students, the parents/caretakers, the school board, and so on.” - Carl Glickman, 2002
At-A-Glance Roster of All Schools Aloha Elementary 233 33 %
Research Multiple sources Use data to drive changes.
The Learning Criteria HSA International Center for Leadership in Education
Collegiality • “When teachers regularly and collaboratively review assessment and [other data-based resources] for the purpose of improving practice to reach measurable achievement goals, something magical happens.” Schmoker, M. The Results Fieldbook, 2001.