Download
1 / 11
110 likes | 211 Views
Water-Quality Measurements in San Francisco Bay – a component of. ~ 40,000 measurements per year. Why Monitoring?. San Francisco Convention & Visitors Bureau Photo. Thanks Dave Tucker. USGS. SERL. USGS-RMP. #1 – Measures Benefits of Actions to Improve Water Quality.

E N D
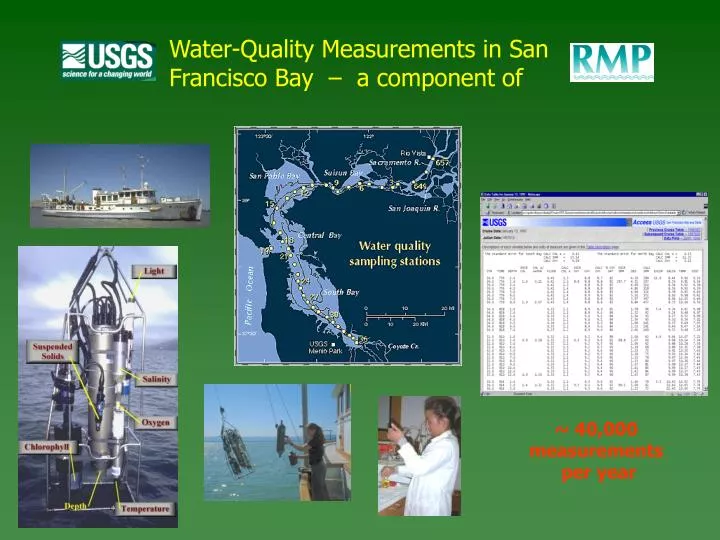
Water-Quality Measurements in San Francisco Bay – a component of ~ 40,000 measurements per year
Why Monitoring? San Francisco Convention & Visitors Bureau Photo
Thanks Dave Tucker USGS SERL USGS-RMP #1 – Measures Benefits of Actions to Improve Water Quality
“Nutrient over-enrichment is a significant problem for the coastal regions of the United States… Of 139 coastal sites .. 44 experiencing symptoms such as low dissolved oxygen, nuisance and toxic algal blooms… National Coastal Nutrient Management strategy … to provide local decision-makers and those responsible for implementing management activities with the information they will need to determine appropriate source reduction goals and methods at the local level.” NRC (2000)
#2 – Measures Environmental Condition so Management Priorities can be Established
But … continued monitoring is essential because …. Dinophysis acuminata Pseudonitzschia delicastissima http://www.nwfsc.noaa.gov/hab/anatomy.htm
wwrcamnl.wr.usgs.gov/tracel/data #3 – Measures Benefits of Reducing Point-Source Inputs of Contaminants
#4 – Identifies Changes in Contaminant Sources Then, point-source inputs Now, urban runoff
Interagency Ecological Program and USGS #5 – Measures Disturbance by Alien Species
303(d) LIST FOR SAN FRANCISCO BAY Exotic Species Mercury Copper Diazinon PCB’s Selenium Nickel “The ecological impacts of the Potamocorbula invasion are as dramatic as any documented in the literature, and provided the impetus for the Board’s 303(d) listing decision.”
Monitoring of the Bay is not complete • Nutrients • Phytoplankton Community • Zooplankton • Ecosystem Processes • Benthos