Download
1 / 18
180 likes | 299 Views
IO Performance. Computer Organization CS 140. The Lab - Overview. The purpose of this lab is to gain understanding of Disks and their behavior. There are essentially two parts to this lab:

E N D
IO Performance Computer Organization CS 140 CS140 Lab08
The Lab - Overview The purpose of this lab is to gain understanding of Disks and their behavior. There are essentially two parts to this lab: • Measure the performance of various disks. This includes a number of different disks and “disk like” entities. It also includes gaining an understanding of the structure of the IO path and how that path behaves. • During Show and Tell, present your findings. Show your data in an orderly and logical fashion – your data should be organized in a way that shows what you find. In order to understand, you may need to do more experiments than the minimum described here. The days of “I don’t understand how I got that answer” are in the past. CS140 Lab08
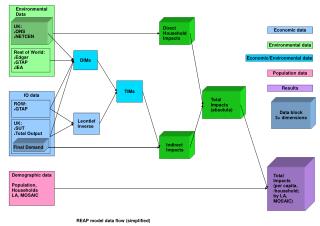
The IO Path ReadWrite.exe Runtime Cache in the program Communicating with a disk isn’t simple. An IO must travel through a number of layers – even more if the disk is on a remote machine. We will be working with three kinds of disks: A USB memory stick – yes it’s actually memory, but because flash memories must be block-erased, making it look like a disk, and causing it to operate through the file system is a great idea. A local disk – one that’s mounted on the machine where you’re running the program. Remote disk – on another machine. OS Cache OS Cache Network Driver Driver Bus Bus Disk Cache Disk Cache Spinning Media Spinning Media CS140 Lab08 Remote Media Local Media
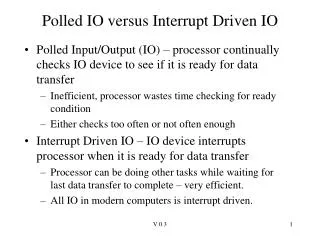
Cache Behavior Caches store data: Disk accesses are painfully time consuming. So caches as seen on the previous page work the same way as processor caches. Caches assume there is temporal and spatial locality of data. Caches hold on to data already read in, on the assumption that data will be needed again. They hold on to modified data assuming that data may be written again; they act as write back caches. They also pre-read data – you ask for one block, and the system may well bring in the next few blocks. The disk cache is especially clever and reads all the data on the track where the requested data is located; why spin around again if it’s easy to hang on to the data. Steady State Behavior: Steady state behavior means that there’s a steady, continual, and not too-fast flow of IO requests. If this flow is slower than the slowest component in the IO path (usually the spinning media) then all is happiness. Pulse Behavior: Occurs when IO requests come faster than the slowest component can handle it. The advantage of this behavior is that you can then watch the actions of that slowest component. Cache Size: Size matters – bigger is obviously better. When you buy a disk, it comes with a fixed size cache – it will never change. But the OS cache is much more dynamic; the OS allocates memory to disk cache, processes, etc. based on the various demands; so the OS cache is never the same – on most systems you can figure out the size at any instant in time. Block Consolidation: All IO to the disk is of at least a block in size – that’s 4096 bytes on Windows and LINUX – your program may ask for 17 bytes, but the OS will bring in at least 4096 bytes and cache the remainder. When you do many small writes, the OS hangs on to your requests until an entire block has aggregated. Similarly, the disk cache tries to take multiple requests, if they’re close together on the disk, and honor them all at the same time – make one request and read/write multiple blocks; what a win! CS140 Lab08
Cache Behavior What happens with sequential IO: So your program is happily making disk requests. Sequential IO means that it writes block 0 in the file, then block 1, then block 2, etc. It can make these requests very quickly. But the disk can also satisfy them very quickly because the cache does consolidation and sends to the disk a request to write a large number of blocks – it could well be 100 blocks at a time. Now the program can still request a lot faster than the cache/disk can write, but the program goes very quickly. What happens with random IO: Random IO means that the program is randomly asking for blocks anywhere in the file – this can defeat the cache’s inherent worth since there’s no locality of reference. It’s a whole different story here. The program can still make rapid fire requests, but the cache can’t do consolidation and so the disk becomes a major bottleneck. What happens with Writes: A write is “unpended” – by this it means that the system doesn’t require that the data get to the disk before the system call returns to the calling program. As long as the data gets to the OS cache, the system is happy. Now it’s possible to override this behavior, and thus ensure the data gets to the disk on every program request, but we’re not using such behavior (it’s called a “fflush” if you want to modify the program. The reason for this is that the program may not depend on whether the write finished – it can go on with other tasks while the disk does its job. What happens with Reads: A read system call is suspended until it completes. This is because the program supposedly needs the data that’s being read before it can proceed – so the program halts, waiting for the successful read. But where does the read get its data – this is just like processor caches. The data may be in the OS cache – if found there, then the read is very fast. It may be in the Disk cache because we just read the previous block and the disk was smart enough to get this next block as well. Or it may be in neither cache in which case we must get it from the spinning media. Controlling where disk reads get their data will be a major challenge in this project. CS140 Lab08
Spinning Media Behavior Our closet lab machines all have a disk manufactured by Seagate called a Barracuda 7200.10 ST380815AS. http://www.seagate.com/ww/v/index.jsp?vgnextoid=809a4d4b57cb0110VgnVCM100000f5ee0a0aRCRD You can look it up and learn characteristics including the: Average Seek time (but be careful – we’re using only a very small part of the disk, so our seek times should be better than that measured by the manufacturer. Rotation time – from this you can determine the average time to wait because of rotational latency. On-disk cache serves two purposes: On a disk write, it is not necessary for the data to be placed on the spinning media for the disk to report that the write has succeeded. Thus you will get a very short time to write a block if the number of blocks you request is such that they can all fit in the disk cache – you’ve generated a burst of activity that all can be cached. Also if you’re doing sequential writes, the spinning media can stash the blocks very rapidly. You will find it useful to generate write requests that overflow the disk cache and thus reflect the true characteristics of the media. On a disk read, the main advantage of a cache is on read-ahead. Then if you’re doing sequential reads, the data will already be in the disk cache and can be returned immediately without waiting for the spinning media. You would be advised to read Section 11.6 on Disk Performance in your text; The notes for this have been incorporated in the slide set for Chapter 7. CS140 Lab08
Description of ReadWrite.c Usage: write <file pathname> <blocks to write> <Read|Write> <Sequential|Random> 1. The path of the file to be created/written to. By default, the program will write to the current directory. If you give a complete pathname, it will write to that location. 2. The number of 4K blocks to write to the disk. 3. Read or Write to the disk.( R or W is enough) 4. Is the data transfer Sequential or Random.( S or R is enough) To examine the performance of any computer component, you need the appropriate tool. In the same way there are many kinds of screwdrivers, designed for various purposes, this disk performance tool COULD have endless variations – each twist would provide additional information about the IO subsystem; but unfortunately the tool would become more and more complicated. The tool given to you here tries to strike a balance; not too many options, but enough to get interesting results. The code that provides this functionality is called ReadWrite.c download here.exe • Notes: • You can determine your destination media by choosing the path correctly. This is described later. • Watch out – there’s a relationship between 4K blocks, the block sizes reported by the various tools, (which are often 1K blocks), megabytes, etc. • We’ve previously described Read/Write, Sequential/Random – here’s where you get to choose them. • When doing a read, make sure you’ve written all the blocks necessary in the file. For instance, a random write may not fill the entire file – there may be blocks missing. If you try to read that file, you could very possibly take an error because you’re trying to read what doesn’t exist. CS140 Lab08
jbreecher@dijkstra:~/public/comp_org/Lab08$ df Filesystem 1K-blocks Used Available Use% Mounted on /dev/mapper/VolGroup00-LogVol00 25837436 6027008 18476772 25% / /dev/sda2 101105 17563 78321 19% /boot tmpfs 516912 0 516912 0% /dev/shm 140.232.101.133:/home 709068768 87426816 585623360 13% /home jbreecher@dijkstra:~/public/comp_org/Lab08$ ReadWrite /tmp/big 100000 Write Random Elapsed IO Time = 1.203017 seconds jbreecher@dijkstra:~/public/comp_org/Lab08$ ReadWrite /tmp/big 200000 Write Random Elapsed IO Time = 145.504208 seconds Description of ReadWrite.c The “df” command shows the disks mounted on this machine. The first is the local disk on a LINUX machine. This one says that there’s 25% of the disk used. The 140.232…../home shows the mount of disks from spears our fileserver. Why do you suppose these two runs required such totally different times? What made the difference? WARNINGS: Cleanup is important. You’re writing large files all over the place. Use /tmp as the location for your local files. Your remote files will go in your own directory. Please remember to clean up, otherwise we’re doing backup for your trash files. If you login remotely, do NOT run this code on the gateway machine, younger. CS140 Lab08
The IO block next accessed (read from or written to) is random in the range 0 to highest block specified. It takes all these lines to do that. StartTime = GetTimeNow(); // Start our timing for ( i = 0; i < BlocksToWrite; i++ ) { if( Sequential == FALSE ) { // Seek to a random location in the file FileLocation = ( BlocksToWrite * (long long)rand()); FileLocation = ( FileLocation )/RAND_MAX; // Which Block FileLocation = BUFFER_SIZE * FileLocation; // ByteOffset SeekSuccess = fseek( File, (int)FileLocation, SEEK_SET ); if ( SeekSuccess |= 0 ) ErrorHandler( "ERROR - the seek failed\n" ); } if ( ReadOption ) BytesTransfered = fread( Buffer, 1, BUFFER_SIZE, File ); else BytesTransfered = fwrite( Buffer, 1, BUFFER_SIZE, File ); if ( BytesTransfered != BUFFER_SIZE ) ErrorHandler( "ERROR - IO didn't transfer number of bytes expected\n"); } // End of for fclose( File ); // Get EVERYTHING to the disk EndTime = GetTimeNow(); printf( "Elapsed IO Time = %f seconds\n", EndTime - StartTime ); Description of ReadWrite.c Does read or write based on request. If IO is sequential, then it is assumed that the block number is monotonically increasing. Closing the file simply means that the data is out of the program; the data is in transit, on its way from the program to the disk. CS140 Lab08
Taking Charge of Your Caches Knowing what you have when you start an IO. By now you know that caches are critical to the good performance of IO. But to analyze IO, you need to know just what the cache is doing to you – you need to be in control of what the cache is doing. Write performance is controlled by the size of a cache – not much you can do about that. Read performance is controlled by the size of the cache, and by what’s in it. And you can take charge of what’s in the cache. If a read finds what it wants in the cache, it’s blazing fast; if it’s not in the cache it has to go to disk – at a significant loss of performance. How do you initialize a cache? If you want a read to find it’s data in the cache you can get the data into the cache by writing the data to the disk. Or you can read the file. Either way puts the data into the cache. (this assumes that the cache has a capacity larger than the file.) If you want a read to NOT find it’s data in the cache, you must clean the cache. One way of doing that is to write data into a second file; the cache now contains data from the second file, so your read of the initial file will not hit in the cache. I haven’t tried this, but I believe if you rename the file, the cache won’t know it’s the same data – try it and let me know if it works. CS140 Lab08
jbreecher@dijkstra:~/public/comp_org/Lab08$ ReadWrite /tmp/big 100000 Write Sequential Elapsed IO Time = 1.493796 seconds Spying on Your Caches The Linux tool available to you that “shows all” is vmstat. A “man vmstat” can teach you all the gory details about how it works and what the various columns mean. In our example below, we will focus on columns “cache”, “bi” and “bo”. For S & T, please be able to explain what’s happening under the CPU section (us, sy, id, wa, st) both in this example and in the vmstat data that you generate. When vmstat is started with an argument, that indicates how often it should print out data – every one second in our case. Note that in the data shown here, the LINUX reported to ReadWrite, and the program reported to us, that the write took 1.49 seconds. But according to vmstat, it took at least 10 seconds to write everything to the disk. Let’s look at this more closely. Now isn’t this amazing. Here is a run of the ReadWrite program – as the program sees it, the write succeeds in 1.49 seconds. The program is merely responding to the close function succeeding; that says the file is in good hands and the writes are complete. vmstat gives the real picture and says it takes many more seconds to get everything on the disk.. CS140 Lab08
jbreecher@dijkstra:~/public/comp_org/Lab08$ ReadWrite /tmp/big 100000 Write Sequential Elapsed IO Time = 1.493796 seconds These show the number of free –1K chunks of memory. Suddenly there’s lots of free memory momentarily when the write starts. Spying on Your Caches Let’s examine a few pieces of vmstat – you will want to explore this great tool in more detail than is possible here. The system (sy) is going wild! This says one whole processor is devoted to running the cache manager and getting all the program blocks into the OS cache. The cache is this size. But watch out – this cache will hang on to data as long as possible – burn memory if that memory isn’t needed for something else. This says that in a one-second period, there were 66,640 chunks of 1024bytes written to the disk. CS140 Lab08
Spying on Your Caches Now that you’re an expert on vmstat, your education has just started. The equivalent OS-spying tool on windows in perfmon. You can practice with this on your home PC, but of course you will eventually be doing your experiments on the lab machines. Starting perfmon -- startrun (open perfmon). Important buttons – are highlighted on the next slide. See the add button on the next page – a useful parameter to add is add( + button ) physical disk Disk Transfers/sec add there’s a lot here – you will want to play around. Try “right click in perfmon” properties graph --<vertical & horizontal grid> Permon produces a graph rather than a list of numbers – this can be easier or harder to interpret depending on the situation. CS140 Lab08
Here again, ReadWrite is lied to. It thinks the transfer finished in 4 seconds whereas the OS was kept busy for 12 seconds. Spying on Your Caches Time measurement – you need to calibrate your grid. This is about 12 seconds. Buttons Clear Display Add Highlight Freeze CS140 Lab08
What Will You Measure • ReadWrite f:\File 10000 Write Sequential • ReadWrite File 10000 Write Sequential • ReadWrite S:\File 10000 Write Sequential Your student shared drive • ReadWrite “/media/Memorex UFD/File” 10000 Write Sequential • ReadWrite /tmp/File 10000 Write Sequential • ReadWrite File 10000 Write Sequential There are six media accessible via windows and LINUX on our lab machines. All of your measurements should be done on these machines. Below is the matrix of what I believe is possible. CS140 Lab08
2. Design an experiment to determine the size of the OS cache. The measurements I did here should lead you in the right direction. Being able to explain what’s happening in these two runs of ReadWrite will go a long way to helping you develop your own experiment. jbreecher@dijkstra:~/public/comp_org/Lab08$ ReadWrite /tmp/big 100000 Write Random Elapsed IO Time = 1.203017 seconds jbreecher@dijkstra:~/public/comp_org/Lab08$ ReadWrite /tmp/big 200000 Write Random Elapsed IO Time = 145.504208 seconds Make sure you have the corroborating vmstat and perfmon data with you for Show and Tell. Related questions: Does Linux or Windows have the best cache performance? How do you best show your data? Does a graph or table do a better job than the raw data? How do you synthesize your results? Note that this is a concrete question with an open ended answer. Real questions are often that way. What will you Measure and Report? Make vmstat your friend. Be able to explain what is reported there, in detail, for one of your experiments. I start this analysis on slide 13, but you should be able to explain the mechanisms in more detail. CS140 Lab08
Disk transfer characteristics. What is the fastest rate that data can be written and read on the local disk? Bring vmstat or other tool output to prove your conclusion. There are many answers to this question that you should provide. (first of all, you need to make sure that you’re actually going to the disk and not being fooled by cached data. Typically this question is answered by measuring • Sequential reads • Random reads • Sequential writes • Random writes • How do these characteristics differ between Windows and Linux on the same machine? What will you Measure and Report? • 4. Disk transfer characteristics. What is the fastest rate that data can be written and read on the floppy disk? Bring vmstat or other tool output to prove your conclusion. There are many answers to this question that you should provide. (first of all, you need to make sure that you’re actually going to the disk and not being fooled by getting cached data. Typically this question is answered by measuring • Sequential reads • Random reads • Sequential writes • Random writes • Can you look up the physical characteristics for the floppy (rotation speed, seek time) how do our results match CS140 Lab08
Evaluation Sheet • Lab 08: Your Name:______________________ • Student is a friend of vmstat and perfmon. Can explain the various fields, especially those useful for our IO measurements. • Student can describe the experiment that determines the size of the OS cache. There’s corroborating evidence presented. • Student can talk about his/her measurement of local disk behavior, on both Windows and Linux. CS140 Lab08