Download

1 / 10
100 likes | 213 Views
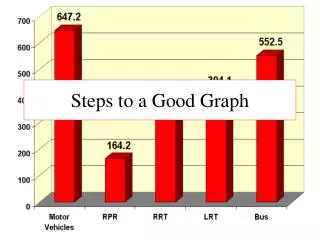
Making a good graph. STEP 1. Always give your graph a title in the following form: "The dependence of (your dependent variable) on (your independent variable). . STEP 2. The x-axis of a graph is always your independent variable and the y-axis is the dependent variable. Step 3.

E N D
STEP 1 • Always give your graph a title in the following form: "The dependence of (your dependent variable) on (your independent variable).
STEP 2 • The x-axis of a graph is always your independent variable and the y-axis is the dependent variable.
Step 3 • Always label the x and y axes and give units.
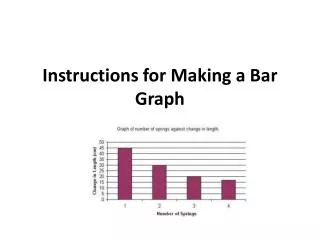
Make sure your data is graphed as large as possible in the space you've been given.
There's no title. What's it a graph of? Who knows? • There are no labels on the x or y axis. What are those numbers? Who knows? • There are no units on the x or y axis. Is this a graph of speed in miles per hour or a graph of temperature in Kelvins? Who can tell? • Somebody played "connect the dots". This should be a nice straight line which goes through the points or a curve that tends to follow them.