Download
1 / 13
130 likes | 247 Views
Data Collection Needs and Methods. Needs . Waves, water levels, runup Offshore, coastal, onshore Meteorological parameters Winds, pressure, precipitation, temperature Oceanographic parameters Temperature, salinity, water quality parameters Streamflow High resolution topography/bathymetry.

E N D
Needs • Waves, water levels, runup • Offshore, coastal, onshore • Meteorological parameters • Winds, pressure, precipitation, temperature • Oceanographic parameters • Temperature, salinity, water quality parameters • Streamflow • High resolution topography/bathymetry
Outline • Permanent measurement systems • Rapidly deployed measurement systems • Possible new types of measurement systems
Long Term Measurement Systems • Satellite • Atmospheric stations • NOAA buoys • Tide Gauges • New Permanent Nearshore Stations • Temporary instruments deployed for hurricane season • Shore and/or Ocean – Based • Video: Argus-type
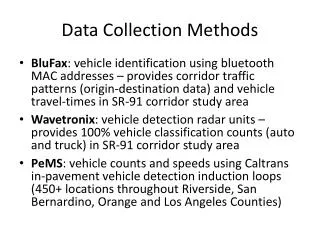
Rapidly Deployed Measurement Systems • Airplane – based • Hurricane hunters: pressure, winds, dropsondes • Scanning Radar Altimeter • Land – based • Water levels, waves, runup • Wind/atmospheric • Possibility of real-time data • Ocean – based • Bottom-mounted: Waves/water levels, currents, salinity • Surface drifting sensors • Autonomous sensors/gliders
Hurricane Gustav • 20 gauges from LA-TX border to FL panhandle • 18 recovered – 16 of 18 good data New Orleans Far east Landfall and strong side West of Landfall Hurricane Gustav
Hurricane Ike 42035 • 9 Gauges Corpus Christi to TX-LA border • 8 retrieved with good data • Some Gustav gauges recorded part of storm
Atlantic Ocean RodantheBreach SR-8 Rodanthe Pier 2.4 km SR-3 Jennette’s Pier 35 km SR-4 Oceanfront New NewBreach 9 km SR-6 Mid-Island 250m SR-1 Soundside Pamlico Sound
Instruments Base(25kg) Float AcousticBeacon Inexpensive Self-Recording Pressure Gauge
Float for retrieval Deployment Instruments • 5-10 bases at a time, depending on helicopter • 10-20 deployments in a day, depending on conditions • Requires good prior connections with helicopter companies 15” Helicopter training for deployment Bases packed for deployment
New Types of Measurement Systems • Shore (pier) or platform – mounted laser wave gauges • Single beam or scanning • Inexpensive drifting wave gauges with one-way satellite communications • Also other oceanographic information • Could have fleets
Questions • What is needed? • Where? • How will measurements best fit into the overall strategy? • What is possible? • Who pays for instruments plus deployment/retrieval/upkeep?