Download
1 / 30
300 likes | 301 Views
This paper presents the general performance of the IceCube detector and the calibration results of the PMT (Photomultiplier Tubes) and DOM (Digital Optical Modules). It includes the comparison between PMT and DOM, detector status in the ice, and future work.

E N D
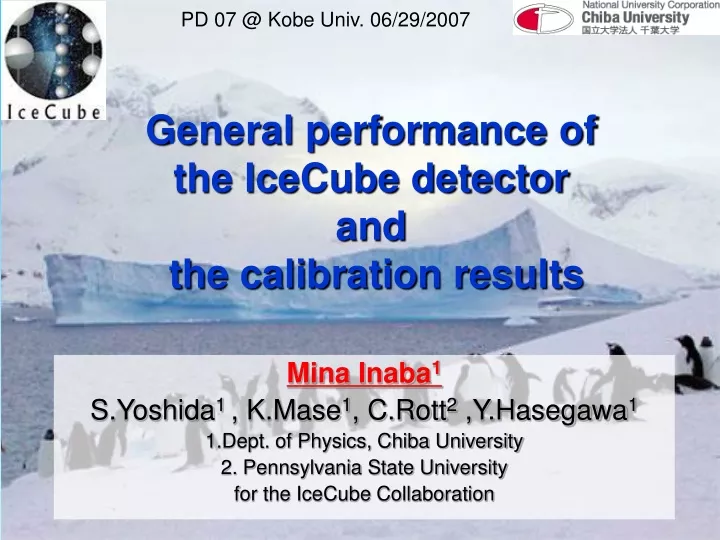
PD 07 @ Kobe Univ. 06/29/2007 General performance of the IceCube detectorand the calibration results Mina Inaba1 S.Yoshida1 , K.Mase1, C.Rott2 ,Y.Hasegawa1 1.Dept. of Physics, Chiba University 2. Pennsylvania State University for the IceCube Collaboration
Outline • Introduction of the IceCube experiment • General performance of the IceCube detector • PMT/DOM Production Procedure • Calibration of PMT • Calibration of DOM • Comparison between PMT and DOM • Detector status in the ice • Summary and future work
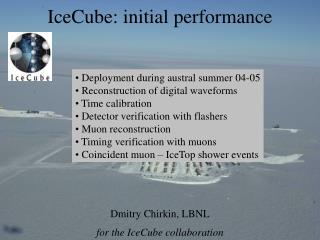
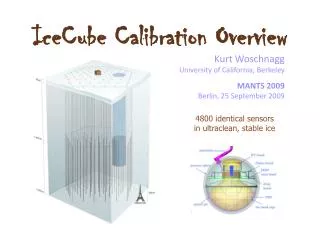
The IceCube experiment South pole ~1 km IceTop IceCube IceCube AMANDA-II • Cherenkov light detector • 60 PMTs x >70 strings = >4200 PMTs • Neutrino energy of 107(SNs)-1020eV • is detectable. • 22 strings are deployed up to now, • and taking data as the biggest • neutrino detector. 1450m 〜1 km 2450m 1km3 1 km
Module of the IceCube Typical digitized waveform Digital Optical Module (DOM) PMT HV Base Board Glass Pressure Sphere Flasher board 35.6cm 10inch R7081-02 PMT Hamamatsu Optical gel Magnetic Shield Cage • Onboard capture of PMT waveforms • - ATWD : 300MHz 14 bits (~400nsec) • 3 different gains (x16, x2, x0.25) • - FADC : 40MHz 10 bits (~6.4μsec)
General performances of the PMT • Type R7081-02(bialkali) • Dynode 10 stages • Quantum efficiency 25% @420nm • Dynamic range 1000p.e. /30nsec @107 gain • Time resolution 2.2nsec • Noise rate 300Hz @ -40℃ ~ -20℃ • Operation gain 1x10⁷@1300V QE Noise rate Dynamic range Charge [pC] Dark count QExCE 25% 300Hz 103 p.e. temp Wavelength [nm]
Production Procedure PMT DOM HV board metal cage Flasher board Main board 10 inch PMT Optical gel Hamamatsu Chiba Univ. Wisconsin Univ. Chiba Univ. South Pole • Golden DOMs: • 2D sensitivity scan • Absolute calibration • Normal check: • Linearity of the PMT gain • dark noise rate • charge resolution • 2D sensitivity scan • Golden PMTs: normal check + • Absolute calibration • assembles DOMs • check all DOMs (under low temperature) • Linearity of the DOM gain • dark noise rate • component check • cold reboot • communication test
Set up of SPE measurement Freezer -32℃ Diffuser attached to the UV LED In the Freezer box 375nm UV LED 2kHz, ~0.01 photo-electron/shot
The parameterization of SPE CR 2 ( ) The exponential term Comes from an incomplete multiplication at the first dynode Fitted the spe charge response with 1 exponential + 1 gaussian terms.
The averaged charge response One measurement Peak of gaussian ~ 1 p.e. Charge resolution 29% Average over 118 PMTs Mean 15% less
Absolute calibration of PMT 337nm N2 laser Energy meter 4x10⁹ Rayleigh scattering 5x10-11 Cathode hit photon# ~0.2 Using Rayleigh scattering Photoelectron# QE= Cathode hit photon# x Energy meter Numerical calculation Rayleigh scattering cross section is well understood
Results of absolute calibration Systematic error Photoelectron# : 1% Light yield : 4% Initial photon fluctuation : 4 % Pressure : 1% Photon energy probe : 5% Total ~8% Our data have a good correlation with Hamamatsu QE measured by Hamamatsu(340nm)%
PMT 2D Uniformity Scan Averaged PMT2D CEMap(~94PMTs) Efficiency depends on the cathode surface. PMT LED motor The direction of the first dynode
2D CE combined with QExCE We can draw Absolute 2D QExCE Map ! CE Map normalized to QE Efficiency[%] 2D Collection efficiency Map Absolute efficiency Length on cathode [m]
2D QE x CE Map of PMT @337nm Systematic error ~8% TA2259 TA2349 TA1895 TA2026 20 0 -0.15m 0.15m 15.0% 16.7% 18.1% 15.5% TA2086 TA2146 TA2182 TA2374 17.9% 16.0% 18.7% 17.8%
Variance of the Collection efficiency By. Y.Hasegawa 90° 0° Variation of the collection efficiency ~ 15% QExCE[%] QExCE[%] 90° 0° Length on cathode [cm] Length on cathode [cm]
Reminder …what is a DOM ? Digital Optical Module = DOM PMT Absolute Calibration Glass + Gel measurement PMT Gel Glass DOM Absolute Calibration
Calibration of DOM QE×CE Absolute calibration 4πCE scanning Reference PMT Absolutely calibrated X-stage LED DOM LED Slit 1mm NDfilter Reflectivity : 14.5%±0.73 Transmission : 50.7%±2.54 Systematic error ~7% @ room
2D QE x CE Map of DOM By. Y.Hasegawa @365nm Systematic error ~7% TA2259 TA2349 TA1895 TA2026 18 0 -0.3m 0.3m 14.0% 15.3% 15.4% 16.3% TA2086 TA2146 TA2182 TA2374 17.5% 16.6% 18.0% 16.0%
Comparison between PMT and DOM Comparison PMT + Glass/Gel DOM Calibration Wavelength [nm] PMT Calibration Transparency of glass/gel
Comparison between PMT and DOM Absolute calibration of DOM 365nm 16.1% 470nm 17.5% LED DOM 520nm 10.7% NDfilter 337nm 8.21% PMT + Glass/Gel 572nm 4.99% Good agreements over the wavelengths.
Detector status Temperature HV -30℃ -10℃ string Shallow ← depth → deep Variation ~7% Mean :1285V IceCube is now working smoothly!! gain rate Variation ~2.5% Mean :1.0 x 10⁷ 700Hz 4.5Hz UTC Time
Summary • General performances of the IceCube PMT were shown. • Averaged charge response and 2D CE map over 100 PMTs are derived. We have implemented the fundamental characteristics of our detector into the detector simulation. • We measured absolute efficiency of our PMTs. Our measurement has a good correlation with Hamamatsu. • We compared between PMT+ Glass/Gel and DOM. It showed good agreement over the wavelength. • IceCube is now taking data smoothly.
Future work Absolute Calibration in the ice Golden DOM Absolute Calibrated detector Standard Candle Calibrated N2 laser Cone reflected light 130.04m
Obtained Parameters Decay time (qtau/q0) Exponential/SPE (P_ex) Charge resolution (sq0/q0) 0.51±0.016 0.30±0.01 0.29±0.01 Summarized by Y. Hasegawa Many PMTs failed to fit at low gain Total 118PMTs (FY2004~2006) statistics is enough to picture average behavior !!
QE measurement at -32℃ QE measured at -32℃was 5~10% lowerthan measured at 24℃ Keno_Inuzaka(TA1056) Daikaku_Inumura(TA1176) Sosuke_Inukawa(TA1181) 16.2% 13.5% 14.3% 15.4% 17.8% 16.7% 11.5% 10.5% 18.0% 17.0% 19.8% 17.6% 12.2% 11.3% 9.89% 9.66% 17.3% 14.4% 5.08% 4.65% 4.58% 4.05% 5.28% 4.29% Red : measured at 24℃ Blue : measured at -32℃
After pulses • show around600nsec • 2 μsec • 8μsec • Peak 13SPE(600nsec) • Rate Hz After pulses ここに測定について 載せる予定です Chirisからの返事待ち Original pulse The various peaks are believed to correspond to ions of different mass
Charge Response @different gains @1x10⁷ @5x10⁷ @1x10⁸ SPE pedestal