Download
1 / 26
260 likes | 393 Views
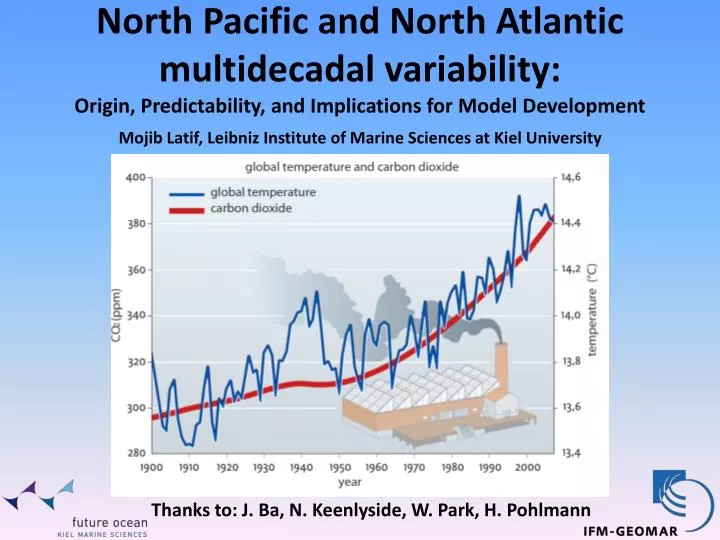
North Pacific and North Atlantic multidecadal variability: Origin, Predictability, and Implications for Model Development. Mojib Latif, Leibniz Institute of Marine Sciences at Kiel University . Thanks to: J. Ba, N. Keenlyside, W. Park, H. Pohlmann.

E N D
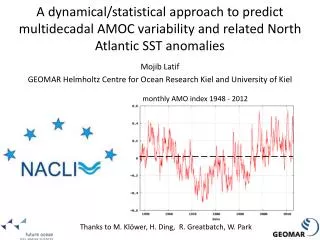
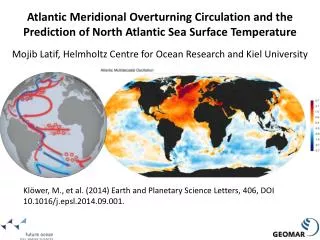
North Pacific and North Atlantic multidecadal variability: Origin, Predictability, and Implications for Model Development Mojib Latif, Leibniz Institute of Marine Sciences at Kiel University Thanks to: J. Ba, N. Keenlyside, W. Park, H. Pohlmann
Deviations of 1999-2008 SAT from long-term warming trend 1950-2008 PDO and AMO can be easily identified
PDO and AMO index at a glance There is a lot of interannual variability (signal-to-noise) PDO and AMO seem not be linked to each other PDO seems to have a slightly smaller period than AMO Hurrell et al. 2010
Scientific questions Can we explain the multidecadal variability by a simple stochastic model? Is North Pacific (PDV) and North Atlantic multidecadal variability (AMV) linked? What provides the memory in the two basins? What are the implications for decadal predictability? How did the Walker Circulation change during the 20th century (external and internal factors)?
Test of the stochastic mechanism 1. ECHAM5-OZ: ECHAM5 (T31) coupled to a multi-level mixed layer ocean (depth 500m), 1000 years (Dommenget and Latif 2008) 2. KCM: ECHAM5 (T31) coupled to an OGCM (NEMO), 4000 years (Park et al. 2009)
SSTA pattern of leading mode and spectra in ECHAM5-OZ aa aa Dommenget and Latif 2008 Atmospheric teleconnections spread the extratropical signal to the Tropics. Once SST anomalies have developed there, the signal is spread globally (referred to as a “Hyper Mode”).
Leading multidecadal mode of SST Observed EOF-1 (32%), exp. trend removed, P > 10 years The spatial structure of observed Pacific multidecadal SST variability is consistent with the “Hyper Mode” picture ECHAM5-OZ EOF-1 (29%), P > 40 years Dommenget and Latif 2008
Is PDV related to AMV in KCM? Park and Latif 2010, subm. Leading mode (40%) has loadings only in the Pacific
Regression patterns, PDV Does show elements of a Hyper Mode
Is PDV related to AMV in KCM? Park and Latif 2010, subm. POP2 (20%) has loadings only in NA. North Pacific and North Atlantic multidecadal SST variability are basically unrelated in KCM. NA SST is not (!) stationary.
Regression patterns, AMV Hyper Mode picture does not apply
3-d T/S EOF1 leads AMOC by a decade T S Jin Ba, IFM-GEOMAR
Stochastically forced AMOC variability Most observational evidence points towards the “ocean-only” oscillator (see also Griffies and Tziperman 1995)
The North Atlantic Oscillation (NAO) NAO-related SAT pattern (°C), +1σ The NAO can affect Labrador Sea convection
The NAOI spectrum is almost white, but there is multidecadal variability weak AMOC? strong AMOC? AMOC may have responded to the multidecadal NAO changes (Eden and Jung 2003)
The NAO: a key for decadal AMOC variability in recent decades? Latif et al. 2006 Time lag is of the order of a decade
Overturning anomalies from forced OGCM Cold phase of multidecadal mode Warm phase of multidecadal mode Forced ocean model (ORCA 0.5°) Alvarez et al. 2008 AMOC changes follow multidecadal NAO changes
What do the ocean analyses show? AMOC at 45°N and 1000m depth from the assimilation experiments of 10 decadal prediction systems (three year running mean are shown) raw values normalized values Pohlmann et al. 2010 There seems to be some consistency in the multidecadal AMOC changes
Implications for decadal predictability • Pacific Decadal Variability is largely consistent with a simple stochastic model (hyper mode). Decadal predictability potential may be only modest. • Atlantic Multidecadal Variability is more consistent with a stochastically driven oceanic eigenmode. This implies a considerably larger decadal predictability potential.
20th Century Walker Circulation Inter-basin zonal temperature gradient (160°W-80°W, 80°E-160°E; 5°S-5°N) and inverted SLP gradient (as defined by Vecchi et al. 2006) • Forced experiments with ECHAM5 with observed SST • Sensitivity to SST forcing (HadISST vs. ERSST) • Sensitivity to the radiative forcing (with and without) • Sensitivity to horizontal model resolution (T31 and T106) • Comparison with 20th century integrations with coupled models • Analysis of the link between SST gradient and SLP gradient in control runs with coupled models • Analysis of internal variability of centennial trends in global warming simulations with one coupled model KCM
Trends in 20th century SST obtained from HadISST and ERSST and SLP response Meng et al. 2010 All SST forced ECHAM5 runs yield a strengthening of the Walker Circulation during the 20th century
20th Century Walker Circulation change Trends in inter-basin SST and SLP gradient ECHAM5 strong circulation Obs. weak circulation Meng et al. 2010 There is a consistent linear relationship between the inter-basin SST and SLP gradient in all climate models
Walker Circulation response in global warming (1%/year increase) runs differences between the last 30 and the first 30 years of the 100 year integrations strong circulation weak circulation 20th century obs. There is no robust response of the Walker Circulation, not even in a single model (KCM)
Summary Can we explain the variability by a simple stochastic model? A large component in NP. Is North Pacific and North Atlantic multidecadal variability linked? Not much. What provides the memory in the two basins? Gyre (NP) and AMOC (NA). What are the implications for decadal predictability? More potential in NA rel. to NP. What are the relative roles of external and internal factors? Internal variability may mask global warming effects even on centennial timescales (e.g. Walker Circulation strength).