Download

1 / 33
330 likes | 487 Views
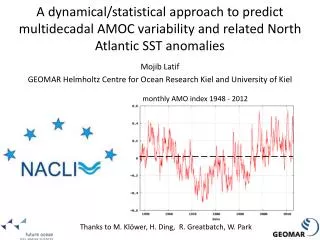
Mojib Latif , Helmholtz Centre for Ocean Research and Kiel University. Atlantic Meridional Overturning Circulation and the Prediction of North Atlantic Sea Surface Temperature. Klöwer , M., et al. ( 2014) Earth and Planetary Science Letters, 406, DOI 10.1016/j.epsl.2014.09.001.

E N D
MojibLatif, Helmholtz Centre for Ocean Research and Kiel University Atlantic Meridional Overturning Circulation and thePrediction of North Atlantic Sea Surface Temperature Klöwer, M., et al. (2014) Earth and Planetary Science Letters, 406, DOI 10.1016/j.epsl.2014.09.001.
Scientific Questions What is the role of the AMOC in decadal North Atlantic SST variability? How predictable is the AMOC-related North Atlantic SST variability? How can we deal with model bias which is particularly large in the North Atlantic?
1. What is the role of the AMOC in decadal North Atlantic SST variability? hypothesis: low-frequency variability of the NAO drives the AMOC (following Eden and Jung 2001) through anomalous surface heat fluxes
The NAO drives convection in the North Atlantic, which in turn drives the “AMOC” Latif andKeenlyside 2011
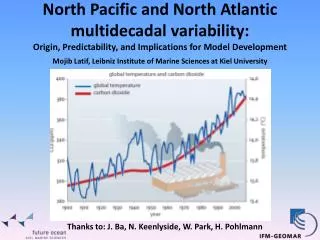
The Kiel Climate Model (KCM) El Niño/Southern Oscillation(ENSO), period ~4 yrs Atlantic Multidecadal Oscillation (AMO/V), period ~60 yrs Pacific Decadal Oscillation (PDO/V), period ~50 yrs Southern Ocean Centennial Variability (SOCV), ~ 300 yrs
The Kiel Climate Model (KCM) simulates rich internal AMOC variability in a 4,000 years long control run AMOC index, 30°N Park and Latif 2008
Surface air temperature anomalies associated with multicentennial and multidecadal AMOC variability multicentennial multidecadal largely independent and originating in different regions Park and Latif 2008
The KCM (T31-L19, 2°) is used to assess the impact of the NAO-related heat fluxes on the AMOC The Kiel Climate Model (KCM) is forced by NAO-related heat flux anomalies Q’net the anomalous heat flux forcing is applied to a coupled model, which distorts the thermodynamic feedbacks less than when forcing ocean models in uncoupled mode
Hypothesis: NAO-related heat flux anomalies drive the AMOC which in turn drives North Atlantic SST a positive phase of the NAO is associated with an enhanced heat loss over the subpolar North Atlantic
Kiel Climate Model (KCM) response when forced by NAO-related heat fluxes 11-year running means NAO index is in phase with mixed layer depth and subpolar gyre, but leads the model’s AMOC by several years
2. Dynamical/statistical prediction of the decadal North Atlantic SST variability The issue of model bias Model bias is large. We can’t expect that the model realistically simulates North Atlantic SST variability linked to AMOC variability
AMOC variability in the KCM 1870-2000 model overturning variability Klöwer et al. 2014 Canonical Correlation Analysis (CCA) was used to statistically relate the overturning variability to the observed North Atlantic SST variability
CCA has been performed between model AMOC and observed North Atlantic SST CCA finds those patterns in two datasets, with time evolutions that are most strongly correlated Klöwer et al. 2014 AMOC leads observed North Atlantic SST by 1-2 decades, use model (KCM) AMOC to predict observed SST
Leading CCA modes SST leads AMOC by 10 years SST lags AMOC by 21 years Klöwer et al. 2014
Link between model AMOC and observed SST at two leads/lags expressed by the leading CCA modes SST leads AMOC by 10 years SST lags AMOC by 21 years Klöwer et al. 2014 …suggests a rather high decadal predictability potential
Statistical hindcast/forecast of the observed AMO index using the model AMOC as a predictor r=0.69 Klöwer et al. 2014 the present AMO warm phase will continue until 2030, but with negative tendency
3. How can we deal with model bias which is particularly large in the North Atlantic? • either by improving the models (tough!) • or by correction methods: flux correction, flow field correction Drews et al., in prep.
Conclusions The NAO is an important driver of the AMOC, which was shown by forcing the KCM by NAO-related heat fluxes This method could be an alternative to initialize decadal predictions, as climate models suffer from large biases The KCM’s AMOC can be used as a predictor to statistically predict with high skill decadal North Atlantic SST variability This study suggests a rather high decadal predictability potential of North Atlantic SST, which solely arises from the history of the NAO The AMO/V is predicted to stay in its warm phase until 2030, but with a negative tendency
Comparison of model SST with observed SST by means of Canonical Correlation Analysis (CCA) time series, CCA-mode 2
Comparison of model SST with observed SST by means of Canonical Correlation Analysis (CCA) patterns, CCA-mode 2
Verification of the Bjerknes hypothesis: atmosphere drives NA SST on short, ocean on long time scales correlation SST/Q, low-pass correlation SST/Q, high-pass Gulev et al. 2013 cutoff at about 10 years
The individual surface heat flux components from reanalysis QLH QSH QLW QSW the turbulent fluxes matter, radiative fluxes are weak, which argues against aerosol forcing of multidecadal SST variability
Evolution of the overturning streamfunction anomaly with respect to the NAO in the KCM the climate model acts as a complicated filter on the NAO-forcing
Hindcast of the AMOC 1900-2010Kiel Climate Model forced by NAO-related heat flux anomalies overturning at 48°N overturning at 48°N, 1500m
Lag-regression of model SST w.r.t. AMOC index at 30°N SST anomaly patterns are strongly influenced by model bias
The problem of model bias, or why we can’t use the predicted model SST CMIP5 multi-model mean SST bias courtesy S. Steinig incorrect path of North Atlantic Current inhibits realistic simulation of SST
The role of wind stress forcing skill in hindcasting observed SST when prescribing observed wind stress anomalies to the KCM correlations based on annual means
Analysis of North Atlantic turbulent surface heat fluxes since 1880 Gulev et al. 2013 suggests that the ocean drives North Atlantic SST at decadal time scales
Comparison of model SST with observed SST by means of Canonical Correlation Analysis (CCA) time series, CCA-mode 1
Comparison of model SST with observed SST by means of Canonical Correlation Analysis (CCA) patterns, CCA-mode 1 observed SST model SST
The individual surface heat flux components from reanalysis QLH QSH QLW QSW the turbulent fluxes matter, radiative fluxes are weak, which argues against aerosol forcing of multidecadal SST variability
NAO-forced mixed-layer depth and AMOC variability corr.: mixed-layer depth with AMOC corr.: NAO with mixed-layer depth
The research leading to these results has received funding from the European Union 7th Framework Programme (FP7 2007-2013), under grant agreement n.308299 NACLIM www.naclim.eu