Download
1 / 1
10 likes | 125 Views
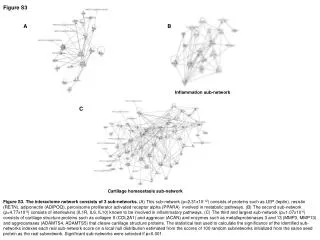
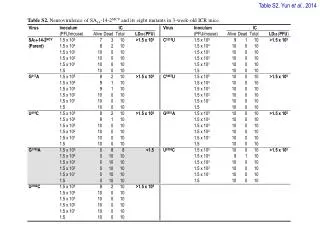
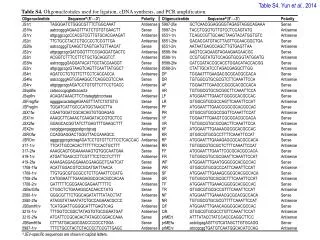
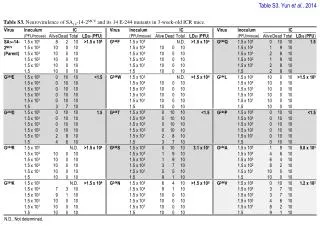
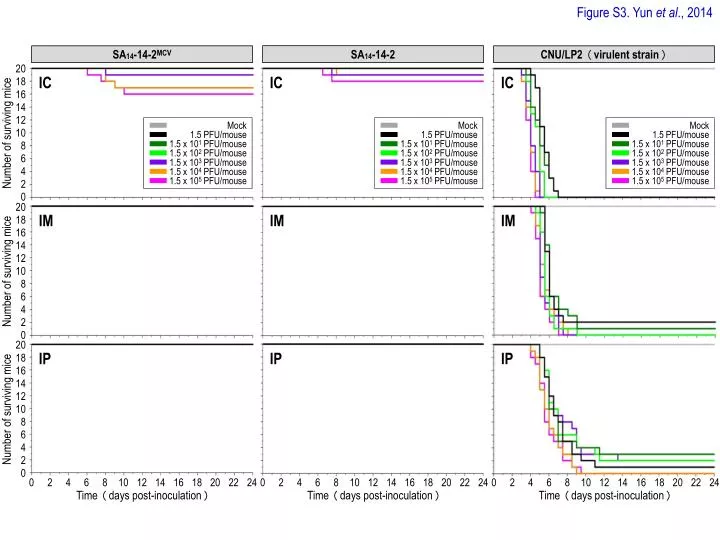
Figure S3. Yun et al ., 2014. SA 14 -14-2 MCV. SA 14 -14-2. CNU/LP2 ( virulent strain ). 20. 20. 20. 18. 18. 18. 16. 16. 16. IC. IC. IC. 14. 14. 14. 12. 12. 12. 10. 10. 10. 8. 8. 8. Mock. Mock. Mock. Number of surviving mice. 1.5 PFU/mouse. 1.5 PFU/mouse.

E N D
Figure S3. Yun et al., 2014 SA14-14-2MCV SA14-14-2 CNU/LP2 (virulent strain) 20 20 20 18 18 18 16 16 16 IC IC IC 14 14 14 12 12 12 10 10 10 8 8 8 Mock Mock Mock Number of surviving mice 1.5 PFU/mouse 1.5 PFU/mouse 1.5 PFU/mouse 6 6 6 1.5 x 101 PFU/mouse 1.5 x 101 PFU/mouse 1.5 x 101 PFU/mouse 4 4 4 1.5 x 10² PFU/mouse 1.5 x 10² PFU/mouse 1.5 x 10² PFU/mouse 1.5 x 10³ PFU/mouse 1.5 x 10³ PFU/mouse 1.5 x 10³ PFU/mouse 2 2 2 1.5 x 10⁴ PFU/mouse 1.5 x 10⁴ PFU/mouse 1.5 x 10⁴ PFU/mouse 0 0 0 1.5 x 10⁵ PFU/mouse 1.5 x 10⁵ PFU/mouse 1.5 x 10⁵ PFU/mouse IM IM IM Number of surviving mice IP IP IP Number of surviving mice 0 0 0 2 2 2 4 4 4 6 6 6 8 8 8 10 10 10 12 12 12 14 14 14 16 16 16 18 18 18 20 20 20 22 22 22 24 24 24 Time (days post-inoculation) Time (days post-inoculation) Time (days post-inoculation)