Download
1 / 25
250 likes | 363 Views
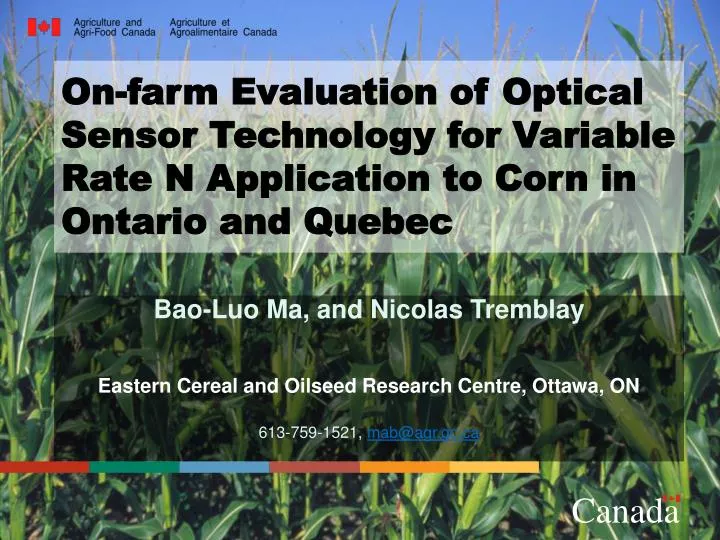
On-farm Evaluation of Optical Sensor Technology for Variable Rate N Application to Corn in Ontario and Quebec. Bao-Luo Ma, and Nicolas Tremblay Eastern Cereal and Oilseed Research Centre, Ottawa, ON 613-759-1521, mab@agr.gc.ca. Canada. Introduction - Nitrogen.

E N D
On-farm Evaluation of Optical Sensor Technology for Variable Rate N Application to Corn in Ontario and Quebec Bao-Luo Ma, and Nicolas Tremblay Eastern Cereal and Oilseed Research Centre, Ottawa, ON 613-759-1521, mab@agr.gc.ca Canada
Introduction - Nitrogen • Fertilizer N represents the most costly input in grain cereal production, especially corn • Producers have to balance crop N needs while minimizing N losses via leaching, emission and runoff • NUE is low, about 50% • Soil physical, chemical and biological conditions tremendously affect NUE • N losses as NO3 to surface and ground water, as N2O and NH3 gases to the atmosphere
- + NO3-N HN4-N Annual Quantitative N Cycle for Corn/Soil/Atmosphere (kg N/ha) Atmospheric N 10 24 10 Corn Crop N (Grain=123; Stover=61; Roots=22) 192 83 Soil Organic N (6000) 14 252 120 14 24 150 23 Fertilizer N
The basic relationship Chlorophyll Nitrogen Grain Yield
Canopy reflectance x Nitrogen Level > N > DW > LA= > reflectance 40 35 High N 30 25 20 Reflectance (%) Low N 15 < N < chlorophyll= > reflectance 10 5 0 400 500 600 700 800 900 Wavelength (nm)
Critical levels 58,0 Y = 33,928 + 0,654x - 0,004x2 R2= 0,98 58,0 55,3 55,3 52,1 52,1 Spad 45,4 45,4 V3 V10 Silking V6 Development stages Figure 1 – Chlorophyll meter mesurements in four corn development stages(Argenta, 2001).
Suficiency index (SI): NDVI in the field = 0.95 • SI = NDVI in the high N reference strip Strip Corn field
ETAA Project Objectives • To develop a crop-based indicator for corn N management that accounts for spatial variability; • To determine if the new vehicle based optical sensing technology is sufficiently robust and practical for on-farm use; • To determine if variable rate N application based on spectral reflectance can improve NUE and corn performance on a farm scale.
ETAA Variable Rate Nitrogen Study - 2005 960ft = 292.6 m 30ft * * * * 7 7 7 9 * * * * * * * * 9 17 27 35 * * * * * * * * 7 9 5 5 3 2 1 6 9 4 3 4 5 9 6 1 2 6 5 1 3 4 2 2 1 6 4 3 * * * * 8 16 34 26 +o o o o * * * * 10 * * * 10 * 8 10 * * * * 7 25 30+60 15 33 o +o + +o + +o +o o * * * * 30+60 30+120 30+120 o + +o o + +o o o o + +o + * * * * 8 * * * 1 2 3 4 5 6 10 11 12 13 14 18 19 20 21 22 23 24 28 29 30 31 32 36 37 38 39 40 Rep 1 Rep 2 Rep 3 Rep 4 North Dimensions Nitrogen Rates Hybrid 1) 0 kg N/ha preplant Pioneer 39D 80 (2550 CHU) 12 rows per plot 2) 30 kg N/ha preplant (26.7 lb/acre) - (Roundup Ready + Poncho 250) 30" rowsplot width = 30 ft 3) 60 kg N/ha preplant (53.4 lb/acre) 4) 90 kg N/ha preplant (80.1 lb/acre) plot length = 80 m (for treatments 1-6), Nitrogen Type 5) 120 kg N/ha preplant (106.8 lb/acre) 6) 150 kg N/ha preplant (133.5 lb/acre) 1) Urea (46-0-0) broadcast preplant 20 m (for treatments 7-10) 7) 30 kg N/ha preplant + 30 kg N/ha sidedress at V6 2) Urea (46-0-0) sidedressed at V6 8) 30 kg N/ha preplant + 60 kg N/ha sidedress at V6 Total Area 9) 30 kg N/ha preplant + 90 kg N/ha sidedress at V6 10) 30 kg N/ha preplant + 120 kg N/ha sidedress at V6 2.34 ha = 5.8 acres * 30 kg N/ha preplant + variable rate N at V6 Revised June 29, 2005
GreenSeeker measures canopy differences at pre-sidedress (2005)
Saturation index shows seasonal N needs (Qc data) Yield difference due to N (t/ha)
Grain yield * * *
15 2 ) y = -0.0002x + 0.077x + 7.3 14 -1 2 R = 0.979 13 12 11 2 y = -0.0002x + 0.066x + 7.3 10 Grain yield (Mg ha 9 2 R = 0.995 8 7 6 0 30 60 90 120 150 -1 Fertilizer (kg N ha ) Preplant 30+sidedress
Ottawa Equipment • Ford 7610 tractor with modified hydraulic returns • Yetter 2995 Bubble Fertilizer Coulters with rear Knife • 250 liter tank with filter • John Blue positive displacement piston pump with flow divider • Rawson Accurate Controller • Dickey John Radar • Raven GPS • GreenSeeker RT200
Ottawa Application • Non-irrigated spring wheat with modified inputs gave a very reasonable application curve • On application day the curve could not be manipulated to suite our rates because of high NDVI values. • Only choice we had was to use the 16 point stepped (not interpolated) graph • In StJean, the non-irrigated spring wheat was manipulated to give a very reasonable curve
Ottawa Rate Accurate controller settings: 9.2 to 36.8 gal /ac was the preset range (30 kg N/ha to 120 kg N/ha) Controller works on percentage change from a mid point. 23 gal/ac as the mid point with 4 % increment giving .92 gal There are 32 increments.
Summary (2005) • Very high grain yield in 2005; yield did not plateau; • Yield was more responsive to sidedress (77 kg/kg N) than preplant (66 kg/kg N) fertilizer N; • Canopy reflectance (NDVI) differentiate low from high soil N • NDVI ranges are narrow, sensitive with crop growth stage • Better economic return with sidedressed fertilizer N. But, further research is needed for variable N rate application.
Summary (2006) • First year of variable rate N application based on NDVI saturation index (SI) • Canopy NDVI values change rapidly from V6 to V8 (plants 2.5-3 feet tall) and can be quickly saturated (NDVI >0.82). • The rainfed spring wheat algorithm provided by the RT-200 GreenSeeker was used in Quebec where NDVIref<0.7 • In Ottawa site, differences in canopy reflectance among preplant broadcast fertilizer N rates was confounded with poor seedling growth under high N rates due to low soil pH coupled with cool spring. • Although such confounding effect was minimal around or after sidedress, it made difficult interpret the NDVI data. • The maximum NDVI value was used to derive SI, and Nmin and Nmax were set at 9.2 and 36.8 gal/ac; variable N rate application was made using the 16 points algorithm. • It is expected that a better NDVI-N requirement algorithm will be available or developed at site for use next year.
Acknowledgements Ontario Soil and Crop Improvement Association Lynne Evenson, Doug Balchin, Vivianne Deslauriers