Download
1 / 59
590 likes | 639 Views
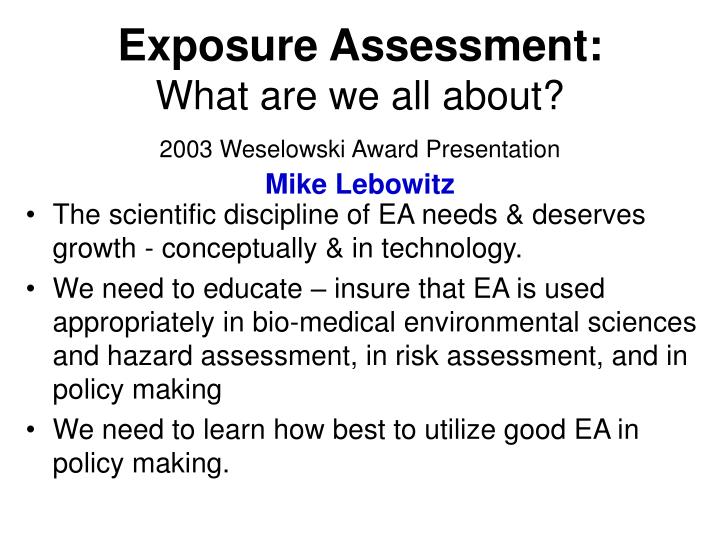
Exposure Assessment: What are we all about? 2003 Weselowski Award Presentation Mike Lebowitz. The scientific discipline of EA needs & deserves growth - conceptually & in technology.

E N D
Exposure Assessment:What are we all about? 2003 Weselowski Award PresentationMike Lebowitz • The scientific discipline of EA needs & deserves growth - conceptually & in technology. • We need to educate – insure that EA is used appropriately in bio-medical environmental sciences and hazard assessment, in risk assessment, and in policy making • We need to learn how best to utilize good EA in policy making.
Environment Physical Biological Agent Host Social Interactions between Host, Agent & Environment
Exposure Assessment • Health Effect (s) • Cancer • Non Cancer • Damage/Disease • Signs/Symptoms • Sources (s) • Properties • Amount Released/Used • Location/Setting • Concentrations • Air • Water • Soil/Dust • Food • Surfaces • Human Exposures • Route • Magnitude • Duration • Frequency • Internal Dose • Absorbed Dose • Target Dose • Biomarkers Effects Assessment Exposure Assessment & the Environmental Health ParadigmSexton (1992)
Steps in Exposure estimation • Environmental Sources & Pathways in Multiple Media • Concentration Measurements (Monitoring) & Exposure Info • Population Distributions of Concentrations in MediaMeasurements of Time-Activity & Other Exposure Factors • Statistical Modeling of Exposure Factors on Exposures Exposure Assessment Modeling
WHO - Biomarkers and Risk Assessment: Concepts and Principles (ICPS, EHC 155, 1993)
WHO - Biomarkers and Risk Assessment: Concepts and Principles (ICPS, EHC 155, 1993)
Exposure & Health Hazard Assessments • Exposure - Dose Estimates • Health Hazards Assessments • Risk Assessments & Proposed Risk Management • Policies & Logistics: • Avoidance, Prevention, & Intervention Programs
300 Air – PM10-Indoor 250 200 GL Value (ug/m^3) 150 100 50 DL 0 BDL 8 18 30 43 55 68 80 92 Percentile 140 120 Air – PM10-Outdoor 100 80 Value (ug/m^3) 60 40 20 0 DL BDL BDL 5.88 20 31 42 54 65 76 87 98 Percentile
Mean Percent Total Ingestion of Metals from Different Sources
Hispanic Ethnicity & Food ContaminationSpecific food types associated with elevated metal concentrations • Hispanicity itself was a significant predictor of lead and cadmium when included in the models (p<.001); retained significance even after adjusting for food types • Significant differences in arsenic and lead; primarily driven by region & outliers • Food from Border Hispanics contains significantly more lead than the food from Hispanics living elsewhere in the State • Most outliers occur in Hispanics vs. non-Hispanics • Significant differences in cadmium - Higher levels among non-Hispanics and in AZ v.s. Border
40 Drinking Water – VOC - chloroform 30 20 Value (ug/L) 10 0 BDL BDL BDL BDL BDL BDL 53 61 69 78 87 96 Percentile 100 50 Tap Water – VOC - chloroform 10 5 1 Value (ug/L) .5 .1 .05 .01 .005 BDL BDL BDL BDL BDL 49 59 69 78 88 98 Percentile
10 5 1 .5 Value (ug/L) .1 .05 .01 .005 .001 BDL BDL 20 30 40 49 59 69 79 89 98 Percentile Tap Water – VOC - toluene 20 18 16 14 12 10 Value (ug/L) 8 6 Drinking Water – VOC - toluene 4 2 0 BDL 10 19 27 36 45 54 63 71 80 89 98 Percentile
All Intercept = -2.602 Coef. = 0.024 SE = 0.010 p = 0.019 R2 = 0.041 Smoking Adjusted Intercept = -4.130 Expos. = 0.132 SE = 0.061 Smoking = 1.317 SE = 0.189 p < 0.001 R2 = 0.305 Benzene: Regression of Blood vs. Indoor Air Concentrations
VOCs: Blood 25%50%75%90% Max N Benzene* 0.046 0.075 0.120 0.375 0.915 149 Toluene* 0.075 0.135 0.288 0.980 3.300 149 Chloroform* 0.005 0.010 0.022 0.038 0.155 122 PCE* 0.012 0.016 0.026 0.068 0.575 150 p-Dichlorobenz. 0.038 0.068 0.205 0.798 51.000 150 - Age, ethnicity, interaction significant *NS: Age, gender, ethnicity
50 50 GL GL 10 10 5 5 Air-Pesticide-Chlorpyrifos (indoor) Air-Pesticide-Chlorpyrifos (outdoor) 1 1 .5 .5 Value (ug/m^3) Value (ug/m^3) .1 .1 .05 .05 .01 .01 .005 .005 DL DL .001 .001 BDL BDL BDL BDL 48 58 68 78 88 98 BDL BDL BDL BDL BDL BDL BDL BDL BDL BDL 98 Percentile Percentile 60 Urine-Pesticide- 356TCPY 40 20 10 Value (ug/g creatinine) 8 6 4 2 1 1 10 20 29 40 48 58 67 77 87 96 Percentile
Exposure Assessment Models • Geographic, Temporal & Sub Population Variability & Assessment of Errors and Uncertainties • Identification of High Exposures • Identification of Potential Problems • Areas, Sources, & Populations (For Policy, Prevention, Avoidance, Mitigation & Other Interventions, and Communications)
Proportion of time spent in different locations by age group
E= [CDsApsTps(1 DOps)] + [CSs(SpsSAps SOps)M] Total Dermal Exposure Model
Estimates of Total Daily Intake Doses (g/day) of Selected Metals (N=176) 25% 50% 75% 90% Cadmium 18.86 23.44 28.87 37.87 Chromium 47.30 66.98 99.37 168.34 Nickel 91.35 135.10 181.23 282.62 Lead 25.0 30.91 39.96 65.95
Smoker vs. Non Smoker Smoker > Non-smoker
Contributions to Metal Exposures • PM10, air and dust Cd concentrations are significantly greater (p < 0.05) in homes with smokers when compared to non-smoking Households. • Individuals who smoke have significantly greater Pb & Cd in blood and Cd in Urine (p < 0.05). • Indoor PM10 correlated with blood Pb: • rs .385 (p=.001) all Households • rs .610 (p=.001) Smoking Households • Food, Beverage and Water are the primary contributors to metal exposures.
Bio-marker Distributions for Select Metals (mg/dL) *Hispanics and non-Hispanics significantly different; # Significantly different by age; see regression results for Ni & Pb; ** No significant differences The two significant regressions of biomarkers on total daily dose estimates were for Ni (involving age and hispanicity as well); and Pb (involving sex and hispanicity,after which neither age nor the total daily dose were significant).
Lead Dose Distribution by MediaContribution to Lead Dose for an Adult Male at the 90th Percentile of exposure for each Media
Weighted and un-weighted mean metals intake for Hispanic and Non-Hispanic Whites, AZ NHEXAS
Descriptive Statistics for Drinking Water Chemical Residue Concentrations in Tap and Non-tap Water *Sample size is not adequate for distribution fitting, percentile value is calculated from empirical cumulative distribution ** Median tap water concentrations of Arizona and Border are significantly different with Mann Whitney test
Uncertainty Analysis of Probabilistic ADE Estimates Uncertainty was estimated in a two-step process using the bootstrap technique. 1- selects randomly a set of input to the model variable values, and estimates an exposure value. This step is repeated 1,000 times to formulate one exposure distribution. 2 - the process is repeated 200 times, resulting in 200 exposure distribution curves.
Uncertainty Analysis of Probabilistic ADE Estimates Uncertainty was estimated in a two-step process using the bootstrap technique. 1- selects randomly a set of input to the model variable values, and estimates an exposure value. This step is repeated 1,000 times to formulate one exposure distribution. 2 - the process is repeated 200 times, resulting in 200 exposure distribution curves.