Download
1 / 20
200 likes | 333 Views
PM10: Measurement and modelling. Ronald Hoogerbrugge. Content. National Network Air Quality Information to institutions and public (internet and teletext) Smog and smogprognoses. locations LML. National background Emision data Transportation model (OPS) Calibrated on regional-

E N D
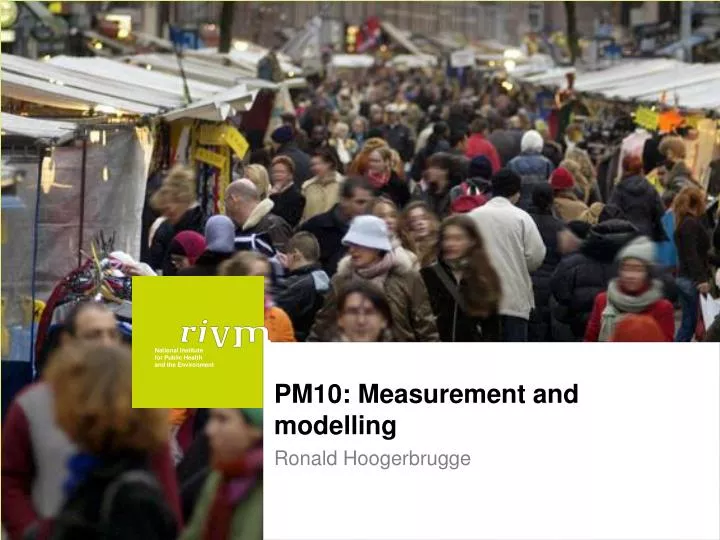
PM10: Measurement and modelling Ronald Hoogerbrugge
Content • National Network Air Quality • Information to institutions and public (internet and teletext) • Smog and smogprognoses
National background Emision data Transportation model (OPS) Calibrated on regional- urban backgroundstations (LML, GGD-A and DCMR) Also 2010 and 2020 Cooperation with PBL
Calibration FAG FH 62 I-R Rural locations Siginificant slope and Intercept 8 locations 763 data pairs -> complies after kalibration (16 %) 1 individual location does not comply (much lower kalibration factor)
Model for local air quality (trafic) • CAR model (application by municipality) concentrationstreet = background + trafficstreet * emissionfactor Municipaly should estimate trafic Result: actual and future exceedances Old: download computer programme New: all integrated in nation wide system “saneringstool”
Dutch decision air quality -> local authorities • Measurement obligation is performed by national air quality network • Municipalities assess in town location where people might be confronted with exceeding levels of air pollution • Permission on new (building) activities depend on the actual/future assessment of air quality (model)
SMOG When smog occurs measures hardly work -> information Information threshold -> passive information website + teletekst Alert threshold (smog) -> active information RIVM press release ANP and provinces en GGD’s SO2 (last 1988) NO2 (last1994) Ozon several in 2003, 2005 and 2006
Smog forecast • Statistical models Ozone and PM10 (standard up to June 2009; today used as backup) • Project for data assimilation surface measurements & satellite pictures. New forecast is launched June 2009 both for PM10 and Ozone.
LOTOS EUROS • 3D chemical transport model • Underestimate (no Crustal matter and sec. org. aerosols) • For The Netherlands calibration on LML stations For Europe no calibration yet Part of MACC model ensemble
1 day NO2 by Sciamachy WWW.TEMIS.NL Important problem: Clouds ! (useful data < 20 % clouds)
Conclusions • Measurements of PM10 by automatic monitors which are equivalent to reference method • Model calculations for compliance with AQ standards use GCN-MAP (OPS calculation with calibration on measurements) • Forecast by LOTOS-EUROS. For Netherlands calibrated on LML data.
PM10 two limit values Yearly average < 40µg/m3 < 35 days with daily average > 50 µg/m3