Download
1 / 49
490 likes | 955 Views
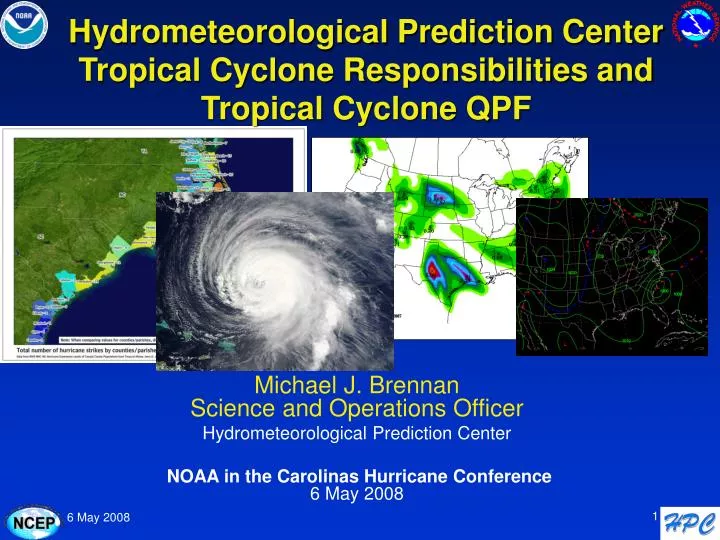
Hydrometeorological Prediction Center Tropical Cyclone Responsibilities and Tropical Cyclone QPF. Michael J. Brennan Science and Operations Officer Hydrometeorological Prediction Center NOAA in the Carolinas Hurricane Conference 6 May 2008. Outline.

E N D
Hydrometeorological Prediction Center Tropical Cyclone Responsibilities and Tropical Cyclone QPF Michael J. BrennanScience and Operations Officer Hydrometeorological Prediction Center NOAA in the Carolinas Hurricane Conference 6 May 2008
Outline • History of HPC’s Tropical Cyclone (TC) Responsibilities • Synoptic Reasoning and Track Forecasting • Tropical Cyclone QPF • Inland Advisories • NHC COOP
History of HPC’s Tropical Cyclone Program Responsibility • HPC (and its predecessor, NMC) have provided track forecast guidance to NHC for at least the last 30 years • Initially done because NMC had access to much more global model guidance than NHC • NHC COOP program • HPC/NMC has been the official NHC backup since at least 1978 • Overhauled and modernized in 2002-2003 • HPC began providing the rainfall statement for NHC’s public advisories in 2005
Synoptic Reasoning and Track Forecasting • HPC provides track forecast guidance (points) to NHC for TCs west of 60°W • HPC’s synoptic reasoning provided on Hurricane Hotline conference call • Day 6 & 7 TC positions for HPC medium range charts coordinated with NHC in daily Noon conference call Day 6 Forecast of Ernesto HPC Medium Range Prog Valid 12Z 31 August 2006
Synoptic Reasoning and Track Forecasting • HPC takes advantage of expertise in large-scale pattern diagnosis to compliment NHC track forecast • HPC track forecast not constrained by continuity and can react more to run-to-run changes in model guidance • Ensures HPC has working forecast in place for all TCs west of 60°W in case backup for NHC needed
TC Rainfall – Major Contributor to Annual Precipitation in Southeastern U.S. 2005 Annual Rainfall (mm) 2005 TC Rainfall (mm) 10-20 % of annual rainfall from TCs Images Courtesy Frank Marks (AOML/HRD)
Factors Impacting Rainfall Distribution in Landfalling TCs • Storm size (positive) – the larger the TC, the more it rains at any given spot • Storm track (location) • Diurnal cycle – core rainfall overnight, outer band rainfall during the day • Topography – enhances rainfall in upslope areas, but decreases past the spine of the mountains • Wind shear (negative) – leads to a quicker drop-off in rainfall for inland TCs • Interaction with nearby features (troughs, fronts/jets), extratropical transition can greatly modify rainfall distribution
Depth of Upper Trough Causing Recurvature Key • Storms which drop most of their rain left of track recurve due to significant upper troughs in the westerlies • Rainfall streaks out well north of the system due to jet streaks moving around the upper trough and frontogenesis at the trough’s leading edge • Trough transitions from positive to negative tilt during interaction with TC • Storms where most rain occurs to the right of track are steered predominantly by shear lines or through a break in the subtropical ridge • Rainfall tends to be concentrated near and right of track Atallah et al. (2007) Mon. Wea. Rev.
Bertha (1996) 250-mb height and wind Bertha moving around break in subtropical ridge Upper trough and jet well northwest of Bertha’s track 00Z 13 July 15Z 13 July Norman W. “Wes” Junker
Floyd (1999) 250-mb height and wind Floyd interacts with positively-tilted upper trough more directly Precipitation forms in pronounced jet entrance region 00Z 16 Sep 12Z 16 Sep Norman W. “Wes” Junker
“Predecessor” Rainfall Events • Coherent area of rain displaced poleward of TC • Maximum rainfall rates exceeded 100 mm (~ 4 in.) in 24 h • Moisture transport from TC toward PRE 47 PREs associated with 21 TCs were identified during the period from 1998-2006 (~2 PREs per TC) ~1/3 of all U.S. landfalling TCs produced at least one PRE Five cases where TC did not make U.S. landfall PRE Slides courtesy Matt Cote & Lance Bosart – SUNY Albany Gaston 1800 UTC 040830 WSI NOWRAD Radar Mosaic
Southeast Recurvatures • 7/11 (64%) produced at least one PRE • 16 PREs from 7 TCs • Influential geographical features: • - Gulf of Mexico - Atlantic Ocean - Appalachians • Approximate point of PRE formation Slides courtesy Matt Cote & Lance Bosart – SUNY Albany
PRE Statistics Separation Distance 1086 ± 482 km Median: 935 km Event Duration 14 ± 7 h Median: 12 h Time Lag 45 ± 29 h Median: 36 h Bosart and Carr (1978) conceptual model of antecedent rainfall from Agnes (1972) Slides courtesy Matt Cote & Lance Bosart – SUNY Albany
Track-Relative Location of PREs PRE Locations Relative to TC Track 1998–2006 Potential for flooding in areas not directly impacted by TC rainfall Potential for excessive flooding beginning before arrival of TC rainfall 26 12 9 Slides courtesy Matt Cote & Lance Bosart – SUNY Albany
Southeast Recurvatures CompositeTime of PRE InitiationMatt Cote & Lance Bosart – SUNY Albany 700 hPa Ht (dam) and UVM (μb s-1) 925 hPa Ht (dam), θe (K), and 200 hPa wind speeds (m s-1) • Significant midlevel trough with weak UVM well poleward of TC • Deep meridional flow transports tropical moisture up East Coast • PRE forms: - in right-entrance region of intensifying upper-level jet • - on western edge of θe ridge
Tropical Cyclone QPF • HPC provides rainfall guidance for all TCs with land impacts • Rainfall statements included in NHC’s public advisories and HPC’s advisories on inland systems • Detailed QPF guidance to WFOs and RFCs for river and flood forecasting TROPICAL STORM ERNESTO ADVISORY NUMBER 30 NWS TPC/NATIONAL HURRICANE CENTER MIAMI FL 1100 PM EDT THU AUG 31 2006RAINFALL TOTALS OF 5 TO 10 INCHES ARE POSSIBLE FROM NORTHEASTERN SOUTH CAROLINA INTO THE MID-ATLANTIC STATES...AND THE SOUTHERN AND CENTRAL APPALACHIANS THROUGH SATURDAY...WITH ISOLATED MAXIMUM AMOUNTS OF 15 INCHES.
How Much QPF? • Depends on multiple factors • Availability of moisture • Moisture at T=0 • Moisture flux – more important than the initial moisture! • Intensity of Precipitation • Speed and direction of movement • Training cells • Structured banding • Enhancement by boundaries and/or topography • Precipitation efficiency • No “proven” Quantitative method for QPF Yet!
HPC TC QPF • HPC TC QPF process incorporates: • Global models • GFS, ECMWF • Mesoscale models • NAM • Ensembles • SREF • Hurricane models • GFDL, HWRF • Climatological models • R-CLIPER • Satellite techniques • TRaP • Extensive in-house TC rainfall climatology and research • Official NHC track forecast
HPC TC QPF Methodology • Forecasts made in 6-h increments from 0-84 h and in one 48-h period for days 4-5 by 3 forecast desks: • Day 1 QPF • Day 2/3 QPF • Medium Range (Days 4-5) • Starting point is model closest to NHC track forecast • Usually GFS • Locate relevant synoptic scale and mesoscale features (troughs, fronts, etc.) • Use conceptual models, current structure, and pattern recognition to modify/shift QPF • Use TRaP and recent satellite and radar imagery to analyze current structure and rainfall rates
HPC TC QPF Methodology • Look at forecast storm-relative shear and 200-mb winds to further shift/limit QPF • Use climatology (PRISM, R-CLIPER, TC Rainfall Climatology) to: • Adjust amounts and numerical guidance biases • Depict areas of terrain that could be significantly impacted • Provide a reality check • Create TC rainfall statements for the Public Advisories • Day 1-3 forecasts issued by 06z/10z/18z/22z • Day 4-5 forecasts and 5-day total graphic issued at 00z/12z Day 1-3 QPF Day 1-5 QPF
TC Rainfall ClimatologyUnited States TC Rain Maxima By State
Ensembles • Can help quantify degree of confidence in a forecast and identifying range of possible solutions • Examine spaghetti plot of precipitation isohyets from ensemble members to see areas of overlap and spread • Don’t use ensemble mean QPF – dampens extreme events 1” isohyets from SREF members
HPC QPF Verification • 24-hour Day 1 QPFs have been verified since 1961 • Verified on common 32-km grid based on manual observational precipitation analysis performed at HPC • TC QPF verification has been performed on a “regional” scale for the past 3 seasons • Precipitation from a TC may straddle more than one region • Other systems may influence precipitation in a region • New for 2007 – ECMWF QPF verification HPC QPF Verification Regions
Verification Metrics • Threat Score • Correct . • (Forecast + Observed - Correct) • Measures fraction of observed and/or forecast events that were correctly predicted; Sensitive to hits, penalizes both misses and false alarms • For a perfect forecast: • Correct = Forecast = Observed • to yield a TS of 1 • The worst possible forecast: • Correct = 0, yields a TS of zero
Verification Metrics Bias Forecast _Observed Gauges accuracy of areal/station coverage of specified threshold amount, regardless of accuracy in location Ideal forecast: Forecast = Observed Bias = 1
Seasonal Verification • Verification of all Day 1 QPF for TCs and TC remnants with precipitation impacts in the CONUS • 2005: Arlene, Cindy, Dennis, Katrina, Ophelia, Rita, Tammy, Wilma (8) • 2006: Alberto, Ernesto (2) • 2007: Andrea, Barry, Erin, Gabrielle, Humberto, Henriette (East Pacific), TD 10, Noel (8) • Seasonal threat score and bias from HPC, GFS, NAM, and ECMWF computed • Major changes occurred to all three models during this period • Difficult to identify consistent biases from season to season
2005 Seasonal Verification Threshold (.in) • NAM tends to under-forecast TC precipitation, especially at higher thresholds • GFS has best model bias from 1-6 in.; NAM best at 0.5 in. • ECMWF TS competitive with GFS across all thresholds; ECMWF bias slightly lower than GFS • HPC Bias generally too high, especially at higher thresholds • HPC TS better than the NAM and GFS at all thresholds for tropical systems in 2005
2005 Seasonal VerificationHPC D1 TS Improvement over NAM/GFS 1313.79 % 3393.15 % NAM GFS
2006 Seasonal Verification Threshold (.in) • ECMWF had highest model threat score across all thresholds through 4 in. • GFS and ECMWF had biases near 1 through 3 in. threshold • GFS had pronounced high bias at 4 in. and above • HPC showed most improvement in TS at higher amounts at the expense of high bias • NAM showed lowest TS and worst bias for amounts of 3 in. or greater
2007 Seasonal Verification Threshold (.in) • GFS provided best overall model QPF guidance • HPC showed low bias at highest thresholds, reversing trend of 2005 and 2006 • ECMWF performance worse than previous years, especially above 2 in. threshold • NAM continued to have lowest TS and severe low bias at high amounts • HPC had a better or the same TS as the best model for all 2007 TC total stats Days 1-3 (except amounts > 3” on Day 2)
Gabrielle • Isolated area of heavy rainfall along central NC coast • Not well-predicted by models which struggled with track and structure of the system • HPC showed significant improvement on heavier amounts, particularly on day 2 3 7 5 1 Gabrielle Rainfall Analysis by David Roth - HPC
GabrielleDay 3 QPF valid for 24-h ending 12Z 10 September 2007 HPC GFS NAM ECMWF Threshold (.in) • HPC showed some skill at 1” threshold • All models had zero bias for amounts greater than 0.5”
GabrielleDay 2 QPF valid for 24-h ending 12Z 10 September 2007 HPC GFS NAM ECMWF Threshold (.in) • HPC successfully forecasted location of maximum rainfall and showed major improvement over the models for amounts > 0.50” • Higher HPC TS at 3” came at expense of high bias • NAM had best model forecast – only model to depict any amounts > 1”
GabrielleDay 1 QPF valid for 24-h ending 12Z 10 September 2007 HPC GFS NAM ECMWF Threshold (.in) • HPC and model QPF displaced too far northeast • None of the models hit the amounts > 1” • The NAM had the best TS for 0.50” & 1” • All of the models had a high bias through 2” except ECMWF
HPC Inland Advisories • HPC issues advisories on TCs that have moved inland and weakened below tropical storm strength but still pose a threat of heavy rains and flash floods in the CONUS or adjacent areas within Mexico • Advisories continue even if the low-level TC remnant center dissipates as long as flood threat remains • HPC advisories cease when threat of flash flooding has ended • Advisories issued at 03, 09, 15, and 21 UTC under the following headers: • Atlantic: TCPAT(1-5); WTNT3(1-5) KWNH • East Pacific: TCPEP(1-5); WTPZ3(1-5) KWNH • Links to HPC advisories can be found on HPC webpage, NHC webpage and graphical TWO
HPC Inland Advisories • Primarily focus on potential for heavy rain and flash flooding • Contents of HPC advisories include: • Headline describing the current event • General summary of current watches, warnings, and advisories • Description of the current location, maximum sustained winds, movement, and minimum central pressure of the system • Table listing precipitation induced by the system • Description of the evolution and forecast for the system • Statement including time of next HPC advisory or, if the final HPC advisory, where to find subsequent information • Forecast for the position of the surface center (if it still exists) as long as the system is a flash flooding threat for the CONUS
NHC COOP • HPC is the designated backup for NHC (since at least late 1970s) • HPC will assume forecast responsibility for Atlantic and East Pacific TCs in the event of communications outage or other problems at NHC • Approximately 20 HPC forecasters trained in: • TC analysis and forecasting • Use of ATCF software • Hurricane Program Policy
NHC COOP • Major technical effort to maintain software, scripts, code and to update with annual changes to products, graphics, etc. • Annual in-house exercise, planned and unannounced backup drills performed to maintain proficiency • Implementation of COOP designed to be seamless and transparent to users • Operational NHC products reproduced • NHC website maintained
NHC COOP • COOP program overhaul began in 2002-2003 • 2002 • Simple communications tests to ensure NHC products could be transmitted from HPC • 2003 • All GS-14 and many GS-13 forecasters trained for NHC backup • Began back-up drills on active TCs (issuing full forecast package) • 2005 • Began issuing East Pacific TWO on the 1st Tuesday of every month to test communications and proficiency
NHC COOP • HPC has never officially taken over for NHC, but there have been at least two close calls: • 2003 or 2004: NHC requested backup due to communications problems, but recovered before HPC had to issue products • Hurricane Andrew (1992): NHC sent forecasters to NMC for backup prior to the storm hitting Miami, but NHC remained up during and after the storm
Acknowledgements • HPC Staff, especially • Mark Klein • Jessica Clark • David Roth • Wes Junker • Chris Lauer of TPC
Questions?? NESDIS Media Room Tropical/Winter Wx QPF Basic Wx Surface Analysis Model Diag. Medium Range http://www.hpc.ncep.noaa.gov/ Michael.J.Brennan@noaa.gov