Download
1 / 37
370 likes | 449 Views
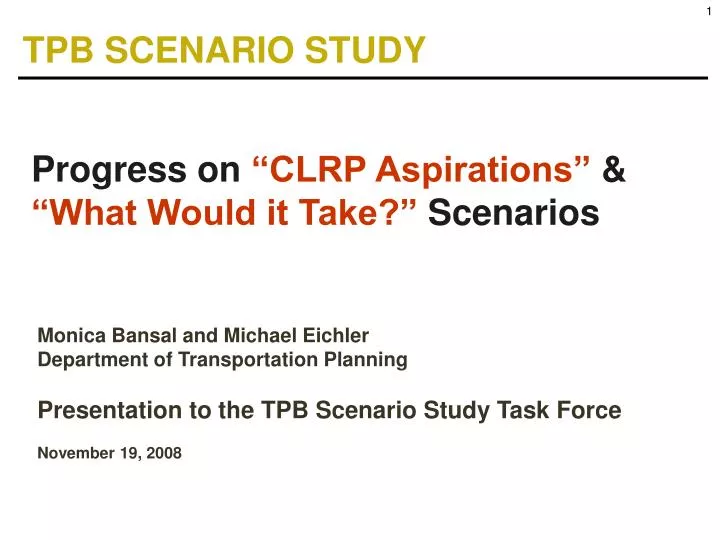
TPB SCENARIO STUDY. Progress on “CLRP Aspirations” & “What Would it Take?” Scenarios. Monica Bansal and Michael Eichler Department of Transportation Planning Presentation to the TPB Scenario Study Task Force November 19, 2008. The Two New Scenarios. CLRP Aspirations.

E N D
TPB SCENARIO STUDY Progress on “CLRP Aspirations” & “What Would it Take?” Scenarios Monica Bansal and Michael Eichler Department of Transportation Planning Presentation to the TPB Scenario Study Task Force November 19, 2008
The Two New Scenarios CLRP Aspirations What Would it Take? Draws on past scenarios (5 transportation/land use scenarios and 2 value pricing scenarios) to provide an ambitious yet attainable vision of land use and transportation for the 2010 CLRP update. Starts with CO2 goals (80% below 2005 levels in 2050 and 20% reduction by 2020) and assesses what scales and combinations of interventions will be necessary to achieve the goal.
Comments Received • Planning Directors • TPB CAC • Scenario Study Task Force Member, Harriet Tregoning, Director, DC Office of Planning • RMAS assumptions are outdated • Tie the scenarios explicitly to the TPB Vision, using a more targeted approach for assigning land-use shifts among activity centers in both scenarios • Should all RMAS scenarios be included?
Based on Planning Director input, newgoal oriented land use component
How will the BRT network provide service to and through the core? -WMATA Priority Corridor Network Routes What criteria do we use for including other non-BRT projects in the scenario? -Projects that provide access to activity centers not otherwise served by transit will be prioritized. What are the details of the transit level of service on the BRT network? - Under development and refinement with Regional Bus Subcommittee Where should the needed park-and-ride lots be located? - Non-Activity Center BRT stations outside the beltway will have parking facilities Transportation Component Questions considered by the task force:
Existing System Existing system of activity centers and high quality transit shows mis-match. Many transit stations without activity and may activity centers without high-quality transit.
CLRP Projects The transit projects in the CLRP work to address some of these concerns.
Recommended RMAS Projects Additional projects evaluated under RMAS should be carried forward, with minor modification to provide transit service to additional activity centers.
Recommended BRT Network A regional network of BRT operating mostly on priced lanes will provide high-quality transit service to nearly all activity centers in the region.
Full Scenario Transit Network This network will provide another layer of high-quality transit on top of existing and proposed transit services.
Recommendations – Transit Network RMAS Projects Recommended as Specified • Include Purple Line as studied, from Silver Spring to New Carrollton • Shorten US-1 (VA) transitway, to run from Braddock Road to Potomac Mills via Ft. Belvoir • Provide transit to Innovation and Gainesville via VRE extension • Shorten Georgia Ave. transitway, providing connection between Glenmont and ICC BRT Other Recommended Connections • Downtown Connections: WMATA Priority Corridor Network: • Service to/through the core provided along H St NE/NW, 7th/9th Sts NW and Rhode Island Ave-US 1 Corridor • Provide transit service to Ft. Detrick/Frederick via extended toll lanes or transitway • Transit service to White Oak Activity Center provided by WMATA Priority Corridor Network transit service
Recommendations – Level of Service What are the details of the transit level of service on the BRT network? • Suggested LOS for the BRT network is as follows: • 12 minute headways during peak periods • 30 minute headways during mid-day off-peak and weekends. • 30 minute headways during PM off-peak • Transit on toll lanes will assume 45 MPH travel speed. • Transit on mixed/priority lanes will assume 15 MPH travel speed. • Assume off-board payment systems for entire network. • Assume all-door boarding at all transit stations. • Assume 60’ articulated vehicles, 5 sets of doors (2 on the left, 3 on the right). • Capacity: 80 passengers seated, total of 120 including standing
Solicit final feedback from the Task Force and Regional Bus Subcommittee Begin network coding. Next Steps November 2008 – December 2008 December 2008
Setting up the WWIT Scenario Goal:To reduce CO2 emissions by 10%, 20% and 80% below 2005 levels in 2012, 2020 and 2050 respectively 3 categories of strategies to reduce mobile CO2 emissions USE of FLEET FLEET Fuel Efficiency Fuel Carbon Intensity Travel Efficiency Reduce VMT through changes in land use, travel behavior, prices Reduce congestion Improve operational efficiency Beyond CAFE standards [currently 35 mpg by 2020] Alternative fuels (biofuels, hydrogen, electricity) Vehicle technology (hybrid engine technology)
How do we use thefleet? (and how can this change)