Download
1 / 36
601 likes | 1.08k Views
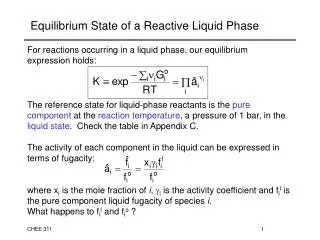
5. Hillel, pp. 129 - 139. Characterization of the Soil Liquid Phase. Characterization of the soil liquid phase. The two most important attributes of the soil liquid phase are: The amount of water in a soil (soil water content)

E N D
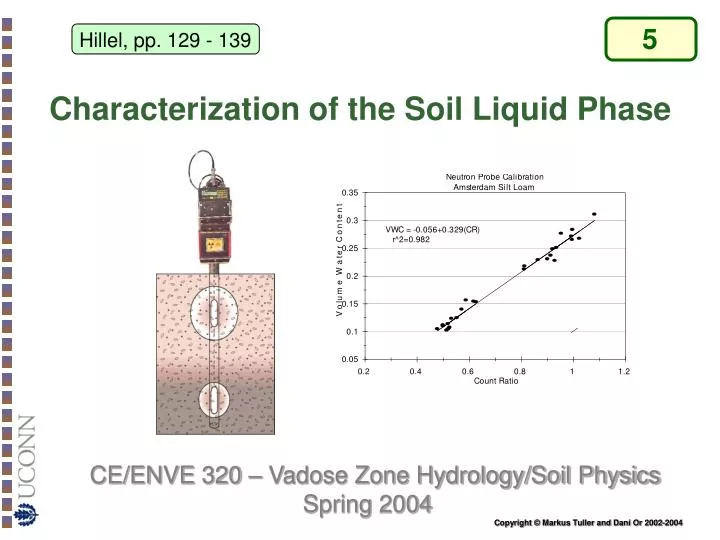
5 Hillel, pp. 129 - 139 Characterization of the Soil Liquid Phase
Characterization of the soil liquid phase • The two most important attributes of the soil liquid phase are: • The amount of water in a soil (soil water content) • The forces by which water is held in a soil matrix (matric potential) • These two attributes are related through the SOIL WATER CHARACTERISTIC (SWC) a highly nonlinear function. Changes in soil water content and matric potential effect many soil transport and mechanical properties, such as (1) ability to transfer liquid and gases; (2) mechanical properties such as soil strength, compactibility, penetrability, and bulk density in swelling soils.
Soil Water Content – Measurement Methods GRAVIMETRIC WATER CONTENT: Samples obtained by digging, augering, or coring are weight (moist sample), and weight again after oven drying (105 oC). VOLUMETRIC WATER CONTENT: Samples with known volume (core samples) may be processed the same way as in the gravimetric water content method. The conversion between gravimetric and volumetric water content requires knowledge of the dry bulk density.
Neutron Probe Sphere of Influence Access Tube rD Dry Probe (Source and Detector) rw Wet Nondestructive methods- Neutron scattering • Neutron Scattering (or Neutron probe) is a widely used field method for repetitive measurement of volumetric soil water content. • It is based on the propensity of water molecules to slow down (thermalize) high energy fast neutrons emitted from a radio active source (Americium-241 – Beryllium). • Thermalized neutrons are counted by a detector present in the access tube (along with the source).
Dry Wet Neutron scattering method • Fast neutrons are emitted radially into the soil and collide with various atomic nuclei. Collisions with most nuclei are virtually elastic with only minor loss of kinetic energy. • Collisions with hydrogen nuclei causes significant loss of kinetic energy and slow down of the fast neutrons (thermalization).
Neutron Scattering Method When the speed of fast neutrons(1600 km/s with corresponding energy of 2-4 MeV)diminishes to that of particles at ambient temperature(2.7 km/s with corresponding energy of 0.03 eV)they are called thermalized or slow neutrons. Thermalized neutrons rapidly form a cloud of nearly constant density near the probe, where the flux (number) of slow neutrons is measured by the detector. The number of slow neutrons is proportional to the number of hydrogen nuclei (water content) The sphere of influence about the radiation source can be approximated with: ~ 15 cm in wet soils ~ 70 cm in very dry soil
Neutron Scattering Method Calibration of the Neutron Probe is necessary to account for background hydrogen sources and other local effects like bulk density. Calibration is achieved by simultaneously measuring soil water content and count ratio CR - ratio of slow neutrons to standard count obtained with the radiation source in the shield.
Instrument and calibration errors • A calibration curve is establish via linear regression - a statistical procedure that assumes linear relationships between two variables enabling prediction of one (dependent variable) from knowledge of the other (independent variable). • Uncertainty in calibration parameters (a and b) due to errors in gravimetric water content determination, bulk density errors, changes in soil texture, and instrument errors. Dependent Variable Independent Variable
Limitations of Neutron Scattering Method • Radiation hazards • Requires site specific calibration • Variable volume of measurement • Not suitable for near-surface measurements • Provides “snap shots”, difficult to automate • Installation and measurements are labor intensive • Limited accuracy
Hillel, pp. 139 - 141 Time Domain Reflectometry (TDR)
Time Domain Reflectometry (TDR) BNC Connector TDR Cable Tester (Tektronix 1502B) • Time Domain Reflectometry (TDR) is a relatively new technique for measurement of volumetric soil water content using electromagnetic waves propagating along embedded waveguides. Waveform 3-Rod Probe
Time Domain Reflectometry (TDR) Advantages: • Superior accuracy to within 1-2% of volumetric water content • Minimal calibration requirements (usually no soil specific calibration necessary) • No radiation hazard such as associated with neutron probe or gamma ray attenuation techniques • Excellent spatial and temporal resolution • Continuous measurements through automation and multiplexing Limitations: • Expensive – typical system costs ~ $4000 • Limited performance in saline soils • Specialized – no “off the self” systems; requires training
Coaxial Cable Epoxy Stainless Steel Rods Time Domain Reflectometry TDR The propagation velocity v of an electromagnetic field along a transmission line (waveguide) of length L embedded in the soil is determined from the time response of the system to a pulse generated by the TDR cable tester.The propagation velocity (v=2L/t) is a function of the soil bulk dielectric constant given by: C…. Speed of light, velocity of the electromagnetic wave in vacuum (3x10⁸ m/s) t…. travel time of the wave along the waveguideback and forth (2L)
Time Domain Reflectometry TDR • The dielectric constant e results from interactions between electromagnetic waves and material properties, it determines the relative speed by which an electromagnetic signal travels through a material. • Low e rapid signal propagation (fastest e=1) • High e slow signal propagation Water ew = 81Soil Minerals es = 3 to 5Soil Air ea = 1
Time Domain Reflectometry TDR • Low e rapid signal propagation (fastest e=1) • High e slow signal propagation • The large disparity between dielectric constant of water and other soil constituents results in dominance of soil bulk dielectric constant eb by the volume fraction of liquid water ew hence dielectric measurements are ideal for soil water content determination. Water ew = 81Soil Minerals es = 3 to 5Soil Air ea = 1
x2 x1 TDR – Basic Principles • A TDR waveform marks reflections produced by an electromagnetic pulse as it traverses the length of an embedded waveguide (2L). • These reflections or “marks” enable determination of “apparent” distance or travel time used to deduce soil bulk dielectric constant: • Vp is a preset relative propagation velocity (often set as Vp=0.99)
2 1 3 1 2 Coaxial Cable 3 Epoxy Stainless Steel Rods TDR – Basic Principles 1: Reflection Coaxial Cable – Epoxy handle 2: Transition Rods (Epoxy) – Rods in Soil 3: Reflection end of rods
TDR probe design and spatial sensitivity • TDR sensor designs seek fewer conductors to reduce disturbance to the porous medium. • Measurement volume and sensitivity varies with design. • Concentration of field lines near conductors emphasize permittivity of soil conditions in this region.
Soil Bulk Dielectric Constant to Water Content Two basic approaches are used to relateSoil bulk dielectric constant ebto volumetric water content qv: Empirical or calibation relationships: such as the 3rd order polynomial proposed by Topp et al. [1980] that seems to fit data for many mineral soils. Topp’s Equation
Physically Based Dielectric Mixing Models Maxwell was among the first to employ a physically based dielectric mixing model that incorporates volume fractions and geometrical arrangement of soil constituents to predict bulk dielectric constant of the mixture [Roth et al. 1990] : n is soil porosity, and -1<b<1 summarizes applied EM field direction relative to medium (axial direction of waveguide).b= 1 for an EM field parallel to soil layeringb= -1 for EM field perpendicular to layeringb= 0.5 for an isotropic two phase mixed medium
Dielectric Mixing Models The mixing model can be simplified using b=0.5 and the dielectric constants of the constituents: ew=81; es=4; and ea=1
Mixing Model: Example What is eb of a soil having v = 0.2 and bulk density of 1325 kg/m3? What if the soil contained the same volume fraction of ethanol rather than water? First we estimate the porosity for this soil as: Then we use b = 0.5 and the dielectric constants of the constituents ew = 81; es = 4; and ea = 1 to solve the mixing model for the bulk dielectric constant eb:
Mixing Model: Example For ethanol and assuming 25oC we substitute the appropriate dielectric of 24.3 (classnotes table 1-4) into the mixing model and receive: Note that because ethanol undergoes relaxation (a change in dielectric constant) within the TDR frequency bandwidth, the apparent dielectric eethanol as measured using TDR is closer to 16. This means that some caution is required in attempting to model the apparent bulk dielectric of soils or other complex mixtures based on tabular values of the component dielectric constants.
Limitations of Empirical Relationships Topp’s model works well for the water content range < 0.5 m3/m3 which covers the entire range of interest in most mineral soils.However it fails for water contents higher 0.5 m3/m3,and for organic soils or mineral soils with high organic matter content. The physically based models work well for the entire range of water content.Note that the soil’s porosity needs to be known!
Limitations of TDR • Relatively expensive equipment • Limited applicability under highly saline conditions, due to signal attenuation. • Soil specific calibration may be required for soils having large amount of bound water or high organic matter content (large surface area). • Requires training and experience. • No “off the self” systems (yet)
Other electrical w.c. measurement methods CAPACITANCE SENSORS Capacitance sensors use an oscillator to generate an AC field which is applied to the soil in order to detect changes in soil dielectric properties linked to variations in soil water content.The sensors essentially consist of a pair of electrodes (either an array of parallel spikes or circular metal rings) which form a capacitor with the soil acting as the dielectric in between. This capacitor works with the oscillator to form a tuned circuit, and changes in soil water content are detected by changes in the operating frequency.
Other electrical w.c. measurement methods HydroSense – Transmission line oscillator (TLO) The Hydrosense probe has electronic components that generate high frequency electromagnetic energy along the length of the probe rods.
Other electrical w.c. measurement methods ECHO PROBES:The Echo probe measures the dielectric constant of a medium by finding the rate of change of voltage applied to the sensor once it is buried in the soil.(TDR measures the dielectric constant by finding the travel time of an electromagnetic wave that traverses a wave guide).
Other electrical w.c. measurement methods Advantages of the ECHO probe are the insensitivity for saline conditions, and low expenses. Only a Datalogger or Hand Read Out is required to send excitation voltage and record the rate of voltage change.
Other methods for soil w.c. measurement OTHER METHODS - X-Ray Computed Tomography (CT)- Nuclear Magnetic Resonance NMR - Ground Penetrating Radar GPR CT-Facility at WSU
Other methods for soil w.c. measurement Ground Penetrating Radar (GPR)
Other methods for soil w.c. measurement Ground Penetrating Radar GPR – suspended horn antenna
Scale (cm) GPR antenna Reflecting canopy layers illuminated region SR TDR probe PT Al termination Other methods for soil w.c. measurement Ground Penetrating Radar GPR – measurements over wheat canopy