Download
1 / 24
240 likes | 317 Views
Part I. How to Perform A Cluster Analysis on Directional Data. Phillip Hendrickson. Caveat.

E N D
Part I.How to Perform A Cluster Analysis on Directional Data Phillip Hendrickson
Caveat • This presentation aims at explaining how a cluster analysis would work on directional data in the first part. Part II reviews my actual project which is regrettably incomplete at this time due to lack of funding for necessary datasets. In lieu of this shortcoming, I will briefly describe how I would further my project along by incorporating directional data.
Introduction • Cluster analysis in the spatial realm has many applications, but the general principal behind any statistical analysis in the spatial world relates to the first law of geography where according to Waldo Tobler, "Everything is related to everything else, but near things are more related than distant things."
Introduction (con’t) • Knowing the first law of Geography, it is difficult to disagree that cluster analysis is a frequently used exploratory procedure in the geophysical world with arguably one of its biggest applications seen in climatology.
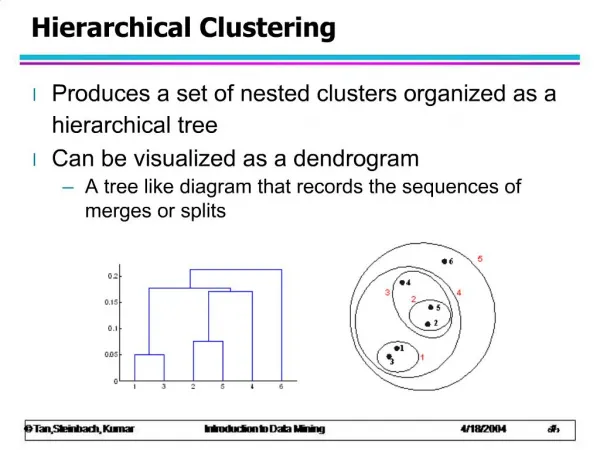
Recap of Cluster Analysis • In class, we touched on how to perform a cluster analysis in which we look at the observations and perform a sequence of steps to see which observations look alike. • Remember: • Develop a classification • Investigate grouping schemes • Data exploration • Hypothesis Testing
Steps involved in Cluster Analysis • Select a sample which reflects the population • Select variables (what is important, what should you measure, what can you measure) • Create a similarity matrix (PMCC or covariance) that has symmetry, equality, distinguishability, and triangle inequality. • Select grouping method (hierarchical agglomerative or k-means)
The Problem with Spatial Data (in some cases) • The steps to conduct a spatial clustering are no different expect that you will automatically have two variables (one for your latitude and one for your longitude). • So what is being introduced here that is different? • How do you analyze directional data?
Directional Data • In many situations a study may require the analysis of directional data (also referred to as aspect). For example, let’s say you want to track a storm event. Already you know you will need to handle wind vectors. Or perhaps you’re interested in geological events such as landslides or earthquakes, chances are good that you will need to process slope angles.
The Problem With Directional Data • Statistics for linear data will not work for directional data because there is no accounting for circular nature (1º and 359º are only 2º apart) • If you tried to force linearity you would essentially cut the circle in half which would negate the observations you cut out and prevent any proper clustering.
Exploit Periodicity • Lund 1999 suggests a method for univariate directional clustering that uses the circular nature of directional data to find an optimal number of clusters from the dataset.
Location and Dipersion • A measure given by the first trigonometric moment • Asks if there exists a positive finite Borel measure on the unit circle whose first n trigonometric moments take some specified values
Parameters • μ - mean direction • Measures the location of the distribution • p - mean resultant length of ϴ • Measures the dispersion also referred to as r bar • Values close to 0 indicate large dispersion and values close to 1 signify a high degree of concentration in the data.
How to Identify Clusters • We use the measure of dispersion • Clusters are made with reference to the largest arc lengths between observations Mean resultant length of the entire dataset would be 0.05 , but separated into two clusters, the mean resultant lengths are 0.88 and 0.87 Lund 1999 FIG. 1
How To Measure Significance of Clusters • k clusters are determined by the k largest spaces denoted . To calculate the significance of the clusters: Large values of represent a high level of clustering between clusters.
The Optimal Amount of Clusters • This will be the number of k clusters which maximizes the significance. • Values of significance can be negative, but occur only when data is evenly distributed.
Part II.Spatial Clustering of Ice Storm Vulnerability in New England
Abstract • The New England region of the United States is periodically hit by severe winter weather which endangers county residents, damages transportation infrastructure, and devastates local economies. • This project implements the use of cluster analysis and GIS to perform an exploratory investigation in order to understand which counties within the New England states are under the most strain from these potentially disastrous events. • The scope of this project looks at all recorded icing and glazing events from 1993 to 2009 in the New England region and forces regional clustering through spatial data.
Data • My cluster analysis uses data from NOAA covering a 16 year period which lists the counties by state that were hit by each ice storm or glazing event from 1993- 2009. • US census data was provided by John Mackenzie from the FREC Department.
Methods • Extensive data mining was performed using Microsoft Excel • Storm events were matched and joined to counties by FIPS code using VLOOKUP • A pivot table was constructed to get total ice storm events per county in the New England region • Using JMP a cluster analysis was performed • Variables included: • Population age 65 and up • Population density • Poverty • Number of households • Number of events in 16 year period • Decimal degrees for longitude and latitude of county centroids
Methods (con’t) • Using ArcMap, a Hot Spot analysis was performed and weighted by the clusters calculated from JMP.
Results • Cluster analysis in JMP returned an optimal amount of 10 clusters using the “Elbow Method” introduced by Robert Thorndike in 1953
Results (con’t) Proposed vulnerability ranking regarding frequency of events: 5 10 3 6 9 7 1 2 4 8
Further Analysis • Incorporate TIGER and DEM data into this analysis to find the most vulnerable counties with regard to paved road surfaces (a large factor that should dictate an areas vulnerability) • Use DEM data to get aspect from the topology. With more time, use directional clustering mentioned in part I to discover which elevations and slope faces are more frequently affected by ice storm events.
Conclusions • In hindsight I would have selected fewer clusters for my analysis, but in terms of an exploratory project, I would say this cluster analysis met with success. In the future it may be interesting to perform this same analysis for other regions of the CONUS. With more time and reliable datasets, I would also like to perform a multivariate directional cluster analysis by incorporating wind data and slope aspect into this project.