Download

1 / 26
270 likes | 453 Views
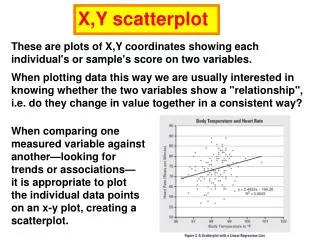
Box & Whisker Plots. Box & Whisker Plots. Objectives : 7.4.01 Collect, organize, analyze, and display data (including box plots and histograms) to solve problems.

E N D
Box & Whisker Plots • Objectives: • 7.4.01Collect, organize, analyze, and display data (including box plots and histograms) to solve problems. • 7.4.02Calculate, use, and interpret the mean, median, mode, range, frequency distribution, and interquartile range for a set of data. • 7.4.03Describe how the mean, median, mode, range, frequency distribution, and inter-quartile range of a set of data affect its graph. • Essential Question: • What is the purpose of organizing data sets into a box and whisker plot?
Box & Whisker Plots What is a Box & Whisker Plot: Lower Extreme (MIN) Lower Quartile (Q1) Median (Q2) Upper Quartile (Q3) Upper Extreme (MAX)
Box & Whisker Plots Vocabulary: • Box & Whisker Plot:a diagram that summarizes data using the median, the upper and lower quartiles, and the extreme values. • Upper Extreme:the greatest value in a set of data. • Lower Extreme:the smallest value in a set of data. • Upper Quartile:the median of the upper half of a set of data; UQ. • Lower Quartile:the median of the lower half of a set of data; LQ. • Interquartile Range: the range of the middle half of a set of data; UQ – LQ.
Box & Whisker Plots One More Example:
Box & Whisker Plots Why Box & Whisker Plots: • - Box and whisker plots use the median, upper and lower quartiles, and the extreme (least and greatest) values to summarize data. • - It allows you to see important characteristics of the data at a glance. - Even though they can be difficult to create, they can provide a great amount of important information.
Box & Whisker Plots Item Fat (gm) Item Fat (gm) Bacon 9 Ham 14 Beefsteak 15 Pork Chop 19 Bologna 16 Roast Beef 5 Crabmeat 3 Salmon 5 Fish Sticks 3 Sardines 9 Fried Shrimp 10 Trout 9 Ground Beef 18 Tuna 7 Example 1:Nutrition Facts • The grams of fat per serving of items from the meat, poultry, and fish food group are shown in the table. Make a box-and-whisker plot of the data.
Box & Whisker Plots Lower Quartile is median of lower half = 5 Upper Quartileismedian of upper half = 15 Example 1:Nutrition Facts Step 1: Order the data from least to greatest. Step 2: Find the Median, L/U Quartiles, and L/U Extremes. Lower Extreme: 3 Upper Extreme: 19 Median: 9 3, 3, 5, 5, 7, 9, 9, 9, 10, 14, 15, 16, 18, 19
Box & Whisker Plots Example 1:Nutrition Facts Step 3: Draw a number line. The scale should include the median, the quartiles, and the lower and upper extremes. Graph the values as points above the. Step 4: Find the median and the quartiles.
Box & Whisker Plots Example 1:Nutrition Facts The graph shows that half of the foods have between 3 and 9 grams of fat. The largest range of the four quartiles is from 9 to 15. One-fourth of the foods were within this range.
Box & Whisker Plots Example 2:NHL Leading Scorers • The table shows the ten all-time leading scorers in the National Hockey League through a recent season. Make a box-and-whisker plot of the data. Then use it to describe how the data are spread.
Box & Whisker Plots Lower Quartile is Median of lower half = 487 Upper Quartile is Median of upper half = 731 Example 2:NHL Leading Scorers Step 1: Order the data from least to greatest. Step 2: Find the Median, Quartiles, Extremes. Lower Extreme: 396 Upper Extreme: 894 Median: 646.5 396, 410, 487, 627, 645, 648, 717, 731, 801, 894
Box & Whisker Plots Example 2:NHL Leading Scorers Step 3: Draw a number line. The scale should include the median, the quartiles, and the lower and upper extremes. Graph the values as points above the. Step 4: Find the median and the quartiles.
Box & Whisker Plots Example 2:NHL Leading Scorers The graph shows that half of the players scored between 487 and 731 points. The largest range of the four quartiles is from 731 to 894. One-fourth of the players scored within this range.
Box & Whisker Plots Independent Practice Problems: The table below shows the commute time from home to school for fifteen middle school students. Make a box-and-whisker plot of the data. Then use it to describe how the data are spread. The graph shows that half of the students travel between 10 and 21 minutes. The largest range of the four quartiles is from 21 to 46.
Box & Whisker Plots Candy Sold Per Student 23 69 27 60 51 46 81 53 46 54 39 55 Independent Practice Problems: Twelve members of the music club sold candy bars as a fund-raiser. The table shows the number of candy bars sold by each person. Make a box-and-whisker plot of the data.
Box & Whisker Plots Why Calculate Outliers: - First, remember that statistics assume all our data values are clustered around some central value - For a box and whisker plot, the IQR tells how spread out the "middle" values are - But it can also be used to tell when some of the other values are "too far" from the central value - Any value that is "too far away" is called an "outlier," because it "lies outside" the range in which we expect it to be
Box & Whisker Plots Calculating Outliers If we want to determine whether a data point is an outlier, we have to do the following: Step 1: Calculate the Interquartile Range (IQR) for our stem and Leaf Plot. IQR = Q3 – Q1 Step 2: Take the Interquartile Range (IQR) and multiply it by 1.5. IQR x 1.5 Step 3: Find: Q1 – (IQR x 1.5) AND Q3 + (IQR x 1.5)
Box & Whisker Plots Lower Quartile is Median of lower half = 487 Upper Quartile is Median of upper half = 731 Example 2:NHL Leading Scorers Looking back at this data set we can determine if any outliers exist Lower Extreme: 396 Upper Extreme: 894 Median: 646.5 396, 410, 487, 627, 645, 648, 710, 731, 801, 894
Box & Whisker Plots Example 2:NHL Leading Scorers Looking back at this data set we can determine if any outliers exist. LQ (Q1) = 487 M = 646.5 UQ (Q3) = 731 UE = 894 LE = 396 IQR = Q3 – Q1 IQR = 731 – 487 IQR = 244 IQR x 1.5 = 244 x 1.5 = 366 487 – 366 121 731 + 366 1097
Box & Whisker Plots Example 3:Box & Whisker Plots (Additional) • Use a stem and leaf plot to graph the following test scores from a recent math test in Mr. Blue’s class: • 76, 76, 76, 77, 80, 80, 80, 81, 81, 82, 84, 85, 88, 89, 89, 89, 89, and 92
Box & Whisker Plots Example 4:Stem & Leaf Plots (Additional) • The set of data listed below shows the number of home runs Babe Ruth hit during his career from 1914 to 1935. Make a box and whisker plot of the data. Then use it to describe how the data are spread. • Home Run Data: 0, 54, 25, 46, 4, 59, 47, 41, 3, 35, 60, 34, 2, 41, 54, 6, 11, 22, 46, 29, 46, and 49.
Box & Whisker Plots Example 4:Stem & Leaf Plots (Additional) • Home Run Data: 0, 54, 25, 46, 4, 59, 47, 41, 3, 35, 60, 34, 2, 41, 54, 6, 11, 22, 46, 29, 46, and 49.
Box & Whisker Plots HOMEWORK
Box & Whisker Plots Example 5:Applying Box & Whisker Plots • Now lets use the Percents Test Data to create a Box and Whisker Plot of the data and then use it to describe the spread of the data. • BOYS SCORES • 99, 36, 16, 23, 69, 58, 59, 21, 53, 19, 21, 82, 30, 85, 70, 81, 66, 42, 53, 52, 22, 56, 43, 57, 88, 80, 53, 86, 64, 84, 68, 79, 57, and 82 • GIRLS SCORES • 73, 37, 61, 53, 37, 38, 24, 30, 75, 93, 65, 85, 60, 92, 80, 56, 80, 65, 77, 64, 95, 99, 82, 75, 94, 98, 63, 58, 69, 56, 95, 77, and 45
Stem & Leaf vs. Box & Whisker Leaf (Boys Data) Stem Leaf (Girls Data) • 9 6 • 3 2 1 1 • 6 0 • 3 2 • 9 8 7 7 6 3 3 3 2 • 9 8 6 4 • 9 0 • 8 6 5 4 2 2 1 0 • 9 • 0 • 1 • 2 • 3 • 4 • 5 • 6 • 7 • 8 • 9 • 4 • 0 7 7 8 • 5 • 3 6 6 8 • 0 1 3 4 5 5 9 • 3 5 5 7 7 • 0 0 2 5 • 2 3 4 5 5 8 9