Download
1 / 6
60 likes | 126 Views
Discussion on Time Interval for Calculating Rain rates For WMO Intercomparison Experiment Vigna Di Valle. 40 meters. Precipitation testbed at Sterling, VA USA The two systems are 40 meters apart and are identical. System consists of Geonor raingauge, single alter shield

E N D
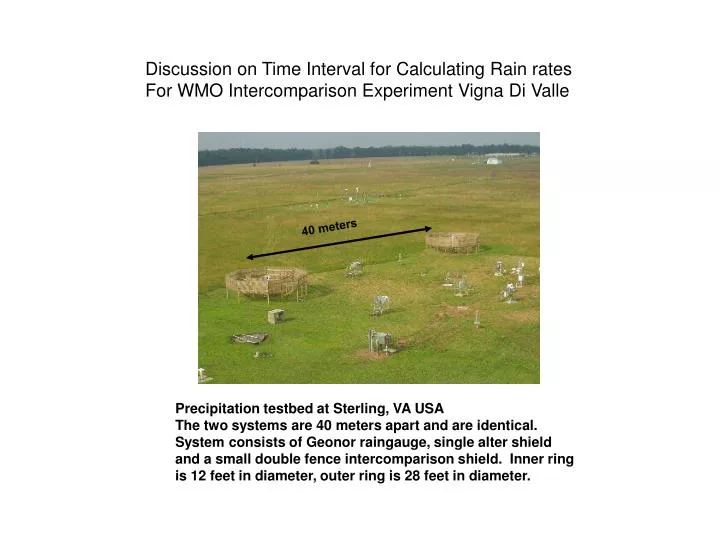
Discussion on Time Interval for Calculating Rain rates For WMO Intercomparison Experiment Vigna Di Valle 40 meters Precipitation testbed at Sterling, VA USA The two systems are 40 meters apart and are identical. System consists of Geonor raingauge, single alter shield and a small double fence intercomparison shield. Inner ring is 12 feet in diameter, outer ring is 28 feet in diameter.
5 precipitation events were chosen to examine the variability in calculating rain intensity from two identical rain gauge configurations. In addition, a brief examination of lag times between two identical shield configurations but different rain gauges for the same 5 precipitation events.
The total rainfall amounts measured by both systems for the 5 events agreed with each other within 1%.
Time Lags Geonor#1 vs. Geonor#2: The time lag is defined as the time when the precipitation amounts from one gauge match those best from another, when time-shifted by the lag amount. The time of the minimum of the squares of differences is this time. For Geonor#1 vs. Geonor#2 the time lag for the 5 days is always 0 minutes Geonor#1 vs. Ott706 The time lags for Geonor#1 vs. Ott706 are as follows: June 1 4 minutes July 4 6 ½ minutes August 7 3 ½ minutes September 8 6 minutes October 20 4 ½ minutes
This short study is meant to stimulate discussion on how to compare The measured rainfall intensity from dissimilar systems and the spatial variability within the test plot.