Download
1 / 1
10 likes | 89 Views
This descriptive research project, via a web-based survey, used quantitative and qualitative data to facilitate the exploration of the vocational education (Voc. Ed) disposition within the five New York City (NYC) boroughs.

E N D
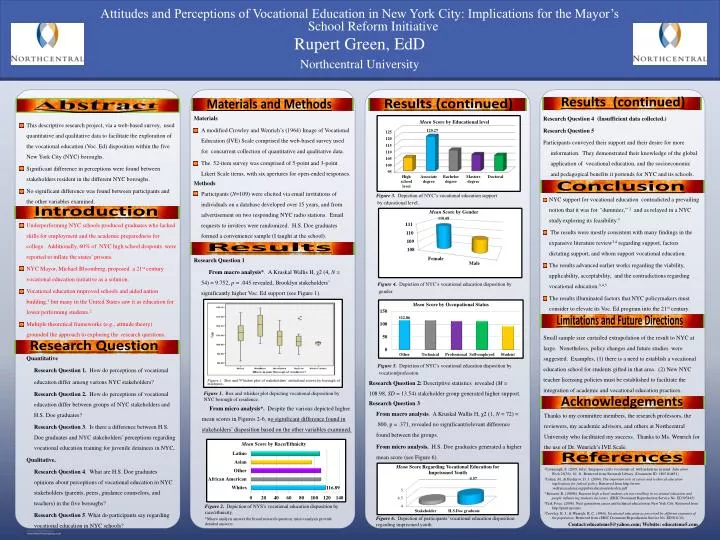
This descriptive research project, via a web-based survey, used quantitative and qualitative data to facilitate the exploration of the vocational education (Voc. Ed) disposition within the five New York City (NYC) boroughs. Significant difference in perceptions were found between stakeholders resident in the different NYC boroughs. No significant difference was found between participants and the other variables examined. Underperforming NYC schools produced graduates who lacked skills for employment and the academic preparedness for college. Additionally, 60% of NYC high school dropouts were reported to inflate the states’ prisons. NYC Mayor, Michael Bloomberg, proposed a 21st century vocational education initiative as a solution. Vocational education improved schools and aided nation building,1but many in the United States saw it as education for lower performing students.2 Multiple theoretical frameworks (e.g., attitude theory) grounded the approach to exploring the research questions. Quantitative Research Question 1. How do perceptions of vocational education differ among various NYC stakeholders? Research Question 2. How do perceptions of vocational education differ between groups of NYC stakeholders and H.S. Doe graduates? Research Question 3. Is there a difference between H.S. Doe graduates and NYC stakeholders’ perceptions regarding vocational education training for juvenile detainees in NYC. Qualitative. Research Question 4. What are H.S. Doe graduates opinions about perceptions of vocational education in NYC stakeholders (parents, peers, guidance counselors, and teachers) in the five boroughs? Research Question 5. What do participants say regarding vocational education in NYC schools? Materials A modified Crowley and Wenrich’s (1964) Image of Vocational Education (IVE) Scale comprised the web-based survey used for concurrent collection of quantitative and qualitative data. The 52-item survey was comprised of 5-point and 3-point Likert Scale items, with six apertures for open-ended responses. Methods Participants (N=109) were elicited via email invitations of individuals on a database developed over 15 years, and from advertisement on two responding NYC radio stations. Email requests to invitees were randomized. H.S. Doe graduates formed a convenience sample (I taught at the school). Figure 4. Depiction of NYC’s vocational education disposition by gender. Figure 5. Depiction of NYC’s vocational education disposition by vocation/profession. Research Question 2: Descriptive statistics revealed (M= 108.98, SD = 13.54) stakeholder group generated higher support. Research Question 3 From macro analysis. A Kruskal Wallis H, χ2 (1, N = 72) = .800, p= .371, revealed no significant/relevant difference found between the groups. From micro analysis. H.S. Doe graduates generated a higher mean score (see Figure 6). Small sample size curtailed extrapolation of the result to NYC at large. Nonetheless, policy changes and future studies were suggested. Examples, (1) there is a need to establish a vocational education school for students gifted in that area. (2) New NYC teacher licensing policies must be established to facilitate the integration of academic and vocational education practices. Research Question 4 (Insufficient data collected.) Research Question 5 Participants conveyed their support and their desire for more information. They demonstrated their knowledge of the global application of vocational education, and the socioeconomic and pedagogical benefits it portends for NYC and its schools. 1Cavanaugh, S. (2009, July). Singapore crafts vocational ed. with industries in mind. Education Week,28(36), 10, 11. Retrieved from Research Library. (Document ID: 1805164851) 3Cohen, M., & Besharov, D. J. (2004). The important role of career and technical education implications for federal policy. Retrieved from http://www .welfareacademy.org/pubs/education/roleofcte.pdf 4 Rossetti, R. (1989b). Reasons high school students are not enrolling in vocational education and people influencing students decisions. (ERIC Document Reproduction Service No. ED305445) 2Task Force. (2008). Next generation career and technical education in New York City. Retrieved from http://print.nycenet 5Crowley, R. J., & Wenrich, R. C. (1964). Vocational education as perceived by different segments of the population. Retrieved from (ERIC Document Reproduction Service No. ED001134). Contact:educateme5@yahoo.com; Website: educateme5.com Thanks to my committee members, the research professors, the reviewers, my academic advisors, and others at Northcentral University who facilitated my success. Thanks to Ms. Wenrich for the use of Dr. Wenrich’s IVE Scale. Figure 3. Depiction of NYC’s vocational education support by educational level. Northcentral University Rupert Green, EdD Attitudes and Perceptions of Vocational Education in New York City: Implications for the Mayor’s School Reform Initiative Research Question 1 From macro analysis*. A Kruskal Wallis H, χ2 (4, N = 54) = 9.752, p = .045 revealed, Brooklyn stakeholders’ significantly higher Voc. Ed support (see Figure 1). Figure 1. Box and whisker plot depicting vocational disposition by NYC borough of residence. From micro analysis*. Despite the various depicted higher mean scores in Figures 2-6, no significant difference found in stakeholders’ disposition based on the other variables examined. Figure 2. Depiction of NYS’s vocational education disposition by race/ethnicity. *Macro analysis answer the broad research question; micro analysis provide detailed answers. NYC support for vocational education contradicted a prevailing notion that it was for “dummies,” 2 and as relayed in a NYC studyexploring its feasibility.3 The results were mostly consistent with many findings in the expansive literature review3,4 regarding support, factors dictating support, and whom support vocational education. The results advanced earlier works regarding the viability, applicability, acceptability, and the contradictions regarding vocational education.3,4,5 The results illuminated factors that NYC policymakers must consider to elevate its Voc. Ed program into the 21st century. Abstract Figure 6. Depiction of participants’ vocational education disposition regarding imprisoned youth. Materials and Methods Research Question Results (continued) Conclusion Results Results (continued) Limitations and Future Directions Acknowledgements References Introduction