Download

1 / 10
120 likes | 432 Views
Normal Curve. 64, 95, 99.7. Normal Curve. The normal distribution is one of the most important distributions. The histogram has this general shape. Normal Curve.

E N D
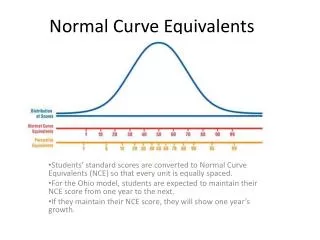
Normal Curve 64, 95, 99.7
Normal Curve • The normal distribution is one of the most important distributions. The histogram has this general shape.
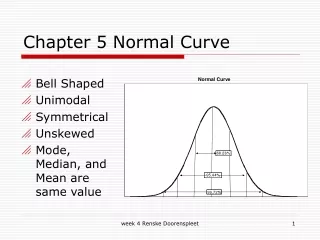
Normal Curve • When the histogram of the normal distribution is smoothed to form a curve, the curve is bell-shaped. This curve is called a normal curve and is used to model the normal distribution.
Normal Curve • The bell can vary in size but they all have the same basic properties. • The curve is bell-shaped with the highest point at the mean µ. • The curve is symmetrical about a vertical line . • The mean, median, and mode are all equal. • 50% of the data values of the distribution are to the right of the mean µ; 50% of the data values are to the left of the mean µ.
Normal Curve • Approximately 68% of the data values fall between and ; that is, 68% are between one standard deviation less and one standard deviation more than the mean. • The normal curve model approaches the horizontal axis, but never touches or crosses the axis.
68-95-99.7 Rule • Normal curves give us an idea of how extreme a value is by telling us how likely it is to find one that far from the mean. • We can find these numbers precisely, but until then we will use a simple rule that tells us a lot about the normal curve.
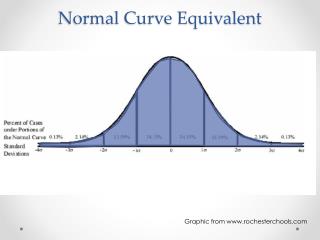
68-95-99.7 Rule • About 68% of the values fall within one standard deviation ơ of the mean µ. • About 95% of the values fall within two standard deviations ơ of the mean µ. • About 99.7% (almost all!) of the values fall within three standard deviations ơ of the mean µ.
68-95-99.7 Rule • The following shows what the 68-95-99.7 rule looks like on the graph.
What is Normal? • Data is considered “normal” if it falls within two standard deviations ơ of the mean µ, or within the central 95% of the curve. • Data is considered “unusual” if it falls outside two standard deviations ơ of the mean µ, or within the upper 2.5% and the lower 2.5% of the curve.
Practice • pg 866 #3 & 4