Download

1 / 14
140 likes | 259 Views
Sampling Error. Dru Rose . I wonder what percentage of all 600 Kare Kare College students travel to school by car ? Population 600 students. S ample. n = 25. Dru Rose . Looking at the world using data is .

E N D
Sampling Error Dru Rose
I wonder what percentage of all 600 KareKare College students travel to school by car ? Population 600 students Sample n = 25 Dru Rose
Looking at the world using data is Like looking through a window with ripples in the glass “What I see … is not quite the way it really is”
Although imperfect, each sample should give a reasonable picture of the population as a whole. • In the real world, we usually only have one sample. We want to use this sample to estimate the population parameter. (make an inference) e.g. estimate the percentage of students at KareKare College who travel to school by car. • Since the sample is representativeof the population, we willre-samplefrom the sample (with replacement)to estimate the sample-to-sample variability iesampling error or margin of error. • Re-sampling from the sample is called Bootstrapping Dru Rose
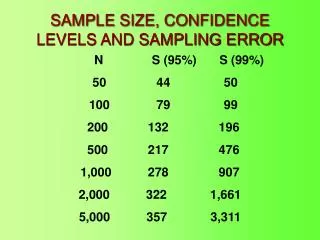
For categorical data e.g. Poll %s, we need large sample sizes to keep the margin of error small. • For a sample of size n =500 and a poll % close to 50% and a 95% confidence level the margin of error is about 4.5% • For poll %s of about 50% (between 30% and 70%) , margin of error ≈ at a 95% confidence level • For poll %s <30% or >70%, the margin of error is smaller • 95% of the time, the 95% confidence interval capturesthe true percentage in the populatione.g. NZ children (in the censusatschool database) who travel to school by car. • We can say, with 95% confidence, that the % of NZ children who travel to school by car is somewhere between 39% and 48 %. Dru Rose
“Opinion Divided on NZ-US exercises” = = 3.7% Margin of error % who support resumption 95% CI: Meaning: Judgement: = 47.6% 47.6% With 95% confidence, we can infer that the % of Nzers who support the resumption of exercises is somewhere between 43.9% and 51.3% 43.9% 51.3% Claim of 50% support for resumption of excercises NOT supported since support could be as low as 43.9%.
Sampling Errors (random) • errors caused by the act of taking a sample (there is always sample to sample variability) • have the potential to be bigger in smaller samples than in larger ones • it is possible to determine how large they can be (margin of error) • unavoidable (price of sampling)
Difference in Poll %s Consider this scenario: MoE = 4% sample % who agree could be somewhere between 46% and 54% A likely new sample Difference in new sample poll %s = 8perct. pts = 2 × MoE • A difference of more than 2 × MoEwould be needed to disprove a claim of 50% agree 50% 50% 54% 46% Dru Rose
Broadcasting Standards Poll (1) Can it be claimed that more young people agree than disagree? = 4.1% Sample Size n = 600 Poll MoE 2 x 4.1 = 8.2 perc. pts Difference 51-44 = 7 perc. pts MoE difference 7 -1.2 15.2 95% CI difference [ -1.2 perc pts. , 15.2 perc. pts.] With 95% confidence, I can infer that more young people may disagree than agree by up to 1.2 perc.ptsand more young people may agree than disagree by up to 15.2 perc. pts Meaning Dru Rose Claim Not Supported Judgement
Broadcasting Standards Poll (1) Can :it be claimed that more young people agree than disagree? [ -1.2 perc pts. , 15.2 perc. pts.] 95% CI difference Alternative way of interpreting this CI: 7 -1.2 15.2 It is a fairly safe bet that the percentage of young people who agree is somewhere between 1.2 perc.pts lower and 15.2 perc. pts higher than the percentage of young people who disagree. Meaning Dru Rose Judgement Claim Not Supported
Comparing Poll %s in independent samples • E.g. Are female students more likely to travel to school by car than males? sample from census at school data base n=500 235 males, % motor = 39.6% (MoE = =6.5%) 265 females,% motor = 47.2% (MoE=6.1%) • 95% confidence interval for the difference (%female-%male): [-1.2 perc. pts ,16.2 perct. pts] With 95% confidence, we can infer that %females who travel by car could be up to 1.2 pc. pts less than the % of males and up to 16.2 pc. pts more. 7.6 -1.2 16.2 Dru Rose
Comparing Poll %s in independent samples • E.g. Are female students more likely to travel to school by car than males? 95% confidence interval for the difference (%female-%male): [-1.2 perc. pts ,16.2 perct. pts] Alternative way of interpreting this CI: It’s a fairly safe bet that the %females who travel by car is somewhere between1.2 pc. pts less than the % of males who travel by car and up to 16.2 pc. pts more. 7.6 -1.2 16.2 Dru Rose
MoE for difference = 8.5% (half CI) = =6.5% MoE Males =6.1% MoEFemales Average MoE= () = 6.3% Rule of thumb for MoE difference = 1.5 x Av MoE= 1.5 x 6.3 =9% We can show that this works about 95% of the time Dru Rose
Broadcasting Standards Poll (2) Can it be claimed that young women were more likely to agree than young men ? = =5.8% = =5.7% MoEmen MoEwomen MoE difference = () = 5.75% Av MoE 1.5 x 5.75 = 8.6% 12 =57-45 = 12 perc. pts Difference 3.4 20.6 95% CI difference [3.4 perc pts. , 20.6 perc. pts.] It’s a fairly safe bet that the % of young women who agreed was somewhere between 3.4 and 20.6 perc. pts more than the % of young men meaning Dru Rose Judgement Claim is supported