Download
1 / 27
270 likes | 415 Views
GPS tropical tropopause temperatures a nd stratospheric water vapor. William Randel 1 and Aurélien Podglajen 2 1 NCAR Atmospheric Chemistry Division 2 Pierre and Marie Curie University - Paris. QJRMS, 1949. The stratosphere is e xtremely dry because a ir is dehydrated

E N D
GPS tropical tropopause temperatures • and stratospheric water vapor William Randel1 and Aurélien Podglajen2 1NCAR Atmospheric Chemistry Division 2Pierre and Marie Curie University - Paris
QJRMS, 1949 The stratosphere is extremely dry because air is dehydrated passing the cold tropical tropopause
Large annual cycle in tropical tropopause temp. QJRMS, 1949 17.5 km
global climatology QJRMS, 1949
Objective: study correlated behavior of stratospheric • H2O and GPS cold point tropopause temps • on daily to annual time scales • Can we understand the large-scale behavior of H2O • in a simple way from accurate temperatures? • When and where does dehydration occur? • Empirical complement to trajectory studies
Data: • GPS radio occultation temps: • Daily data from CHAMP, COSMIC, others • ~3000 obs/day for middle 2006-present • High vertical resolution (~ 1 km), • well-resolved cold point • Saturation mixing ratios Qsat (RH=1.0) • MLS water vapor: • daily gridded fields at 100, 83, 68, … hPa; late 2004 – 2012
GPS temps GPS measurements Daily gridded data set 5o x 20o x 0.2 km 2006 - 2012 gridded
Large-scale variability at the tropical tropopause (10o N-S) time 0 180 360 longitude
GPS Temperaturespectraat 17 km Symmetric Antisymmetric 30 10 10 30 2 3 5 5 3 2 Mixed Rossbygravitywaves Period (days) Kelvin waves MJO Zonal wavenumber Zonal wavenumber westward westward eastward eastward
Temperaturespectraat 23 km Symmetric Antisymmetric 10 30 30 10 2 5 3 2 3 5 Mixed Rossbygravitywaves Period (days) Kelvin waves Zonal wavenumber westward westward eastward eastward Zonal wavenumber
MLS orbital data MLS H2O 100 hPa ~ 16 km gridded
Temps H2O
Tropical tape recorder observed by MLS 2004-2012 cold point tropopause 2012 2010 2011 2007 2008 2009 2005 2006 Cold phase of tropopause annual cycle
Boreal Winter 15oN-S GPS tropopause temperature 100 hPa H2O 2009-2010 time
Boreal Winter 15oN-S 100 hPa H2O GPS saturation mixing ratio 2009-2010 time
Boreal Winter 15oN-S 100 hPa H2O GPS saturation mixing ratio 2009-2010 time
Boreal Winter 15o N-S 100 hPa H2O GPS saturation mixing ratio 2010-2011 time
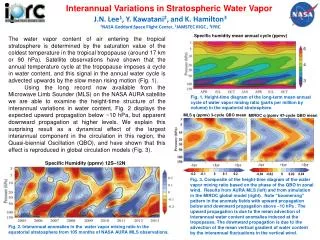
Fractional area of RH>1 for 20o N-S and 100 and 83 hPa Max during boreal winter .30 .15 fraction 0 2007 2009 2010 2011 2008
Fraction of RH > 1.0 at 100 hPa locations wheredehydrationmayoccur 0.25 Summer (JJA) Winter (DJF) 0.45 40 N latitude 40 S longitude longitude Dehydration mainly over ~20o N-S
Fraction of RH > 1.0 at 100 hPa Dehydration locations derived from Lagrangian trajectories Winter (DJF) 40 N 40 S longitude Schoeberl and Dessler 2011
Fraction of RH > 1.0 at 100 hPa Trajectory dehydration location Summer (JJA) 40 N 40 S longitude Schoeberl and Dessler 2011
Distribution of relative humidity in western Pacific Winter (DJF) 40 N frequency 40 S longitude 100% 140%
Key points: • MLS and GPS data sets provide opportunity to understand • H2O – T coupling on daily to interannualtime scales • * links to clouds, dynamics of the TTL • Dehydration regions (RH > 1.0) occur mainly during • boreal winter. Summertime behavior is less-well • understood. • Observed dehydration patterns compare well with • trajectory calculations. Where are the differences?
Zonal averages 15o N-S Qsat at the cold point 100 hPa H2O ppmv 83 hPa H2O Qsat15% driest area
H2O vs. Qsat GPS saturation mixing ratio at locations where RH > 1.0 100 hPa H2O 15o N-S