Download
1 / 51
520 likes | 917 Views
Stratospheric Water Vapor and Deep Convection. Pao K. Wang Department of Atmospheric and Oceanic Sciences University of Wisconsin-Madison Madison, WI 53706 Jan 5, 2007, National Central University. Outline. Water vapor in the atmosphere Some observational facts Conceptual models

E N D
Stratospheric Water Vapor and Deep Convection Pao K. Wang Department of Atmospheric and Oceanic Sciences University of Wisconsin-Madison Madison, WI 53706 Jan 5, 2007, National Central University
Outline • Water vapor in the atmosphere • Some observational facts • Conceptual models • Deep convection and cross-tropopause transport • Plumes above storm anvils • Model interpretation • Some observational verification • Conclusions
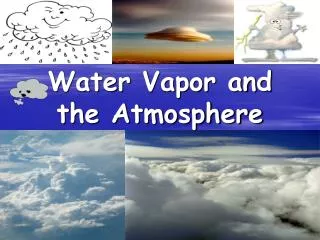
Why worry about water vapor? • Water vapor is the most visible tracer. • Water vapor is the most important greenhouse gas (not CO2!) • The issue of feedback and forcing-topospheric and stratospheric water vapor • Water vapor in the stratosphere • Water vapor is the ingredient for making important ozone-destroying radicals HOx. • Radiative impact of stratospheric water vapor
How does water vapor get into the stratosphere? • Stratosphere is very dry- • dehydration • cold trap • Produced in situ – e.g., oxidation of CH4 • Transported from somewhere else – most likely troposphere – if so, how?
A Conceptual Transport Model of Stratosphere/Troposphere Exchange (Holton et al., 1995)
Questions about this transport scheme • Some recent observations show that not many tropical hot towers reach the tropopause. • On the other hand, our recent studies show that midlatitude thunderstorms frequently penetrate the tropopause and inject water vapor into the stratosphere. • This simple scheme does not explain the observed seasonal variation and north-south asymmetry of the lower stratospheric water vapor concentration.
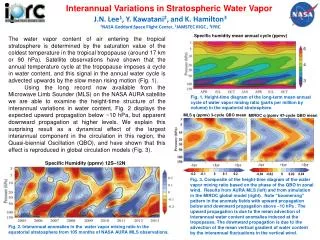
The seasonal variation and N-S vapor asymmetry in the LS by Pan et al. (1997) • SAGE-II data (midlatitude regions) • There are seasonal variations in both NH and SH stratospheres.-both peak at summer • Water vapor in NH stratosphere is general more than in SH.
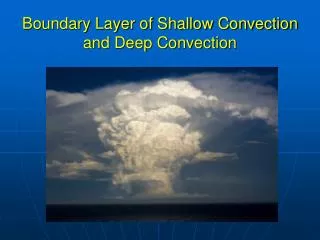
UTLS - region of coupled dynamics, chemistry and cloud microphysics
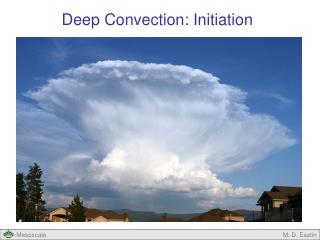
Plumes Above Thunderstorms • Recent satellite observations (AVHRR IR images, GOES visible & IR images) indicate that there are plumes above the anvils of some severe storms. These plumes are believed to exist in the lower stratosphere. More confirmation from MODIS observation. • The following slides show some examples.
MODIS Resolution 250 m 800x600 pixels MODIS – Aqua, 03 June 2003, 19:28 UTC, band 1 Louisiana Courtesy of Martin Setvak
13 July 2004 MODIS Aqua band 1, Northern Illinois (near Chicago)
Animation of CCOPE SupercellCentral Cross-sectionRHi-fieldrhi-x-z-y27.rmNotice the undulating overshooting top
The undulating overshooting top in the thunderstorm occurred on 20 July 2000 near Denver, Colorado, USA(Movie courtesy of Walter Lyons)
RHI-30% contour surface (data below 10 km truncated) rhi-3d.rm Top View of the Modeled Plume
Dynamics of Plume Formation • The strong updraft causes not only the overshooting but vigorous gravity waves in the upper troposphere/lower stratosphere (UT/LS). • Updraft behaves like an obstacle to the flow, causing quasi-mountain wave phenomenon and ship-wave signature in the lee side. • The breaking of gravity waves (probably due to cloud-induced critical layers or strong instability) results in the diabatic transport of water vapor from the shell of the overshooting dome to the stratosphere. • The ice crystals formed in the plumes are probably very small (~ 3-5 mm) and will eventually evaporate and moisten the stratosphere.
Cloud top wave breaking anvil sheet During 20-30 min (every 10 sec) overshooting top During 70-80 min (every 10 sec)
Fujita’s jumping cirrus “One of the most striking features seen repeatedly above the anvil top is the formation of cirrus cloud which jumps upward from behind the overshooting dome as it collapses violently into the anvil cloud”. (Fujita, 1982) Fujita (1989)’s five categories: • (1)Clean overshooting domes • (2)Curly-hair cirrus • (3)Fountain cirrus– cirrus, which splashes up like a fountain, 1 to 2 min after an overshooting dome collapses into an anvil. This appears to be what mentioned in the quotation above. • (4)Flare cirrus– cirrus that jumps 1 to 3 km above the anvil surface and moves upwind like a flare. • (5)Geyser cirrus– cirrus that bursts up 3 to 4 km above the anvil surface like a geyser.
An example of jumping cirrus – Clear signature of the upstream-pointing mountain wave Photo courtesy of Martin Setvak WISCDYMM simulation of CCOPE Supercell
Storms in Bavaria, Germanyviewed from Zurich, Switzerland (Courtesy of Willi Schmid, IACETH)
Standard Mean Ocean Water Water isotopes as tracers of Convection • HDO condenses more readily than H2O • Rainout leads to HDO depletion • Ice injection can make the stratosphere “Heavy” • In situ water isotope measurements can offer a tracer for the condensation history of air parcels D = 1000 ( HDO/H2O/SMOW – 1)
It can explain the high HDO/H2O ratio in UT/LS observed by Kuang et al. (2003) and Harvard ICOS/Hoxotope (slide courtesy of Hanisco et al., 2005) ATMOS tropical profiles Remote observations of Water isotope values are surprisingly “heavy”. Observed D is less depleted than models based on thermodynamic equilibrium. (Moyer, et al., 1996) Convection is identified as a likely source of heavy water in TTL. Z. Kuang, G. C. Toon, P.O. Wennberg, and Y. L. Yung, Measured HDO/H2O ratios across the tropical tropopause, Geophys. Res. Lett., 30(7), 1372, 2003.
What do the plumes do? • Transports water vapor from the troposphere to the stratosphere irreversibly • Can be as much as 500 MT/day (think about radiative impact!) • More…
Is the lower stratospheric water vapor in steady-state condition? • The answer is “No!” • A recent finding by Oltmans et al. [2000], using balloon-borne frostpoint hygrometers, shows that the stratospheric water vapor concentrations measured at two midlatitude locations (Washington, DC and Boulder, Colorado) have increased by 1-1.5% yr-1 for the past 35 years, making the climatic impact of stratospheric water vapor even more likely.
If the global warming causes more penetrating convection, then… In the stratosphere, increasing water vapor can lead to a cooling, while these same increases can lead to a warming nearer the surface. …The balance of the increase in stratospheric water vapor is not explainable at present. (Oltmans, 2003)
Other observations on LS vapor trend • Ground-based, balloon, aircraft and satellite measurements show a global stratospheric water vapor increase of as much as 2 parts per million by volume in the last 45 years, a 75 percent jump. • Modeling studies by the University of Reading in England show that since 1980 the stratospheric water vapor increase has produced a surface temperature rise about half of that attributable to increased carbon dioxide alone. • Methane, which has been increasing in the atmosphere since the 1950s, could be contributing to the water vapor increase. Chemical conversion of methane to water vapor occurs in the stratosphere but can only account for at most half of the water vapor increase.
In a recent study, Polvani and Kushner (2002) showed that a surprising strong tropospheric response is resulted when the stratospheric thermal structure is changed in an AGCM numerical experiment.
Subtropical jet core in the troposphere shifts 10° poleward by changing lapse rate in the polar stratosphere.
So where can be other sources of LS water vapor in tropics? • One possibility is hurricanes (typhoons) • Small scale, small number • But LS doesn’t need to have much water vapor
Not just H2O… • If this process can transport large amount of water vapor (which is highly condensable, hence removable, at the tropopause level) from the troposphere to the stratosphere, how about other gases such as CO, CO2, O3, NOX, SOX, CFCs and aerosol particles?
In short… • This is a cloud process that may have great impact on the global atmospheric chemical transport and radiation, hence climate process. • But this has never been accounted for in climate model predictions!
What we need to know next • What are the ice particle habits, sizes and concentration, etc.? • How long will the ice particles stay in the LS? • How are the ice particles produced? • Transported from the cloud top? • In-situ nucleation? • Transport of various species? • How often do such transports occur? • What are the conditions favorable for cloud top gravity wave breaking? • What are the global impacts?
What we need to do • Concerted observations by satellite, aircraft radar, lidar and conventional techniques to collect facts • Physics-based cloud resolving models to understand and quantify the process • Meso- and large scale models to assess the impacts