Download
1 / 14
140 likes | 261 Views
PATTERNS AND TRENDS IN THE AVAILABILITY AND CONSUMPTION OF WATER. Subject Guide An overview of global patterns and trends in the availability and consumption of water, including embedded water in food and manufactured goods.

E N D
PATTERNS AND TRENDS IN THE AVAILABILITY AND CONSUMPTION OF WATER Subject Guide An overview of global patterns and trends in the availability and consumption of water, including embedded water in food and manufactured goods.
Starter: Complete the key data worksheet above by filling in the relevant information next to each piece of important data.
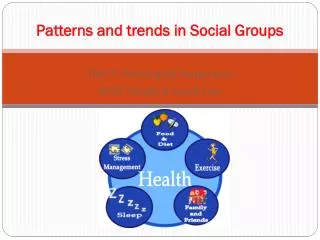
Key terms: • Physical water scarcity: when physical access to water is limited. When demand outstrips a regions ability to provide the water needed by the population. • Economic water scarcity: when the population does not have the necessary monetary means to utilize an adequate source of water.
Describe the differences in water use between HICs and L/MICs in the figure above from UNESCO. Try to explain these differences by thinking about levels of development and economic activity.
1 Use the table to the right and maps and graphs on the previous slides to describe the patterns and trends in water consumption Extra sources: Kognity: 3.1.5 Global water availability Main textbook: Page 475- 476 2. Click on the weebly tab to access a brief summary report from UNESCO on the causes of water shortage and the likely future impacts. i. Take notes on the four main sources that create demand, namely agriculture, production of energy, industrial uses and human consumption. Think back to previous work on rise of middle class population and continuing progress in global development (MDG's - SDG's). ii. Take notes on the likely impacts of climate change on future water supplies and vulnerable populations.
Embedded water A measure of water used in the production and transport to market of food and commodities (can also be known as ‘virtual water’ or ‘water footprint’ )
Virtual water into Europe Compare and contrast the imports and exports of virtual water into Europe using the map
Why is this important? As nations work toward securing food, water, energy and other essential inputs for people’s well being, livelihoods and the country’s economic development, most countries rely on imports as well as exports of goods and services. A country may aim to be self-sufficient by relying primarily on goods that can be produced within its borders. Or a country may choose to reduce the burden on the natural resources within its borders by importing water intensive products.A country may select energy security by using its natural resources to produce electricity in exchange for food security by importing food. The water footprint and its translation into virtual water can illuminate these choices and their inter-dependencies. Virtual water helps us understand the dependencies our economies have on others’ resources.Coupling this with the water footprint enables us to map out the dependencies and to identify when and where risks may lie, in terms of scarcity and pollution. This has implications for food security, economy and diplomacy.For water-scarce countries it can sometimes be attractive to import virtual water (through import of water-intensive products), thus relieving the pressure on the domestic water resources. This happens, for example, in Mediterranean countries, the Middle East and Mexico. Northern European countries import a lot of water in virtual form (more than they export), but this is not driven by water scarcity.
Calculate your water footprint • The Water footprint calculator is an excellent way to investigate embedded water. The calculator starts by assessing 'obvious' water usage, by looking at daily activities that use water plus water-saving devices in the home. The second part of the calculator looks at embedded water but because the calculator is based on the USA there is a question about what State you live in. Pick a State and continue. As you go through all the questions there is a gauge on the left that shows how much water is involved.
Extra information: Invisible water, the hidden virtual water market
INFOGRAPHIC PRACTICE How many LITRESof water does the average American use in a year (you'll need to find a way to convert US Gallons to litres)? How many litres is that each day? If a bucket of water holds about 10 litres of water, how many buckets of water does an average American use each day? Comment on this; does it surprise you (it should!)? Why? What is meant by "hidden water"? What is meant by "Blue water", "Green water" and "Grey Water"? What are the problems if water levels fall below critical levels in rivers? (See whole infographic on link on weebly)