Download
1 / 1
20 likes | 147 Views
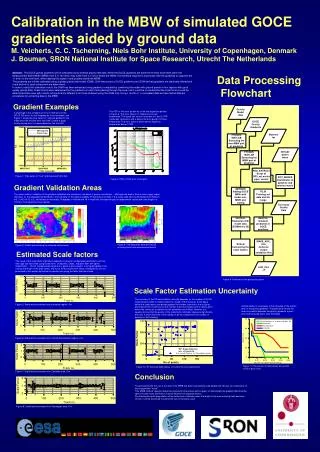
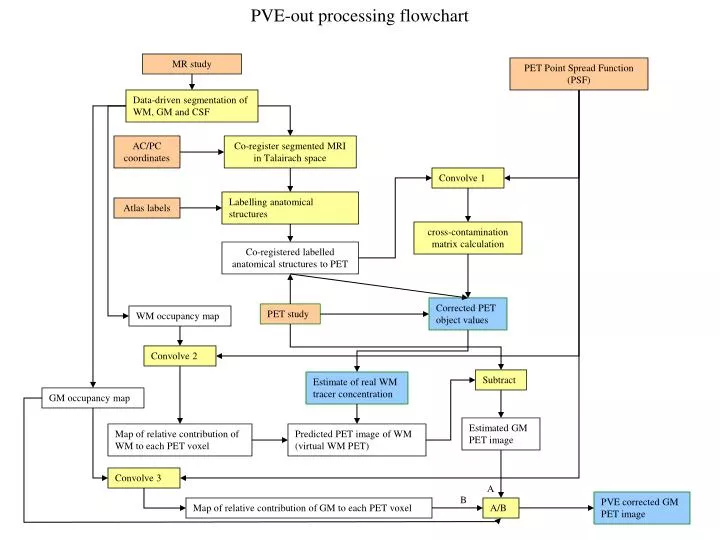
PVE-out processing flowchart. MR study. PET Point Spread Function (PSF). Data-driven segmentation of WM, GM and CSF. AC/PC coordinates. Co-register segmented MRI in Talairach space. Convolve 1. Labelling anatomical structures. Atlas labels. cross-contamination matrix calculation.

E N D
PVE-out processing flowchart MR study PET Point Spread Function (PSF) Data-driven segmentation of WM, GM and CSF AC/PC coordinates Co-register segmented MRI in Talairach space Convolve 1 Labelling anatomical structures Atlas labels cross-contamination matrix calculation Co-registered labelled anatomical structures to PET Corrected PET object values PET study WM occupancy map Convolve 2 Subtract Estimate of real WM tracer concentration GM occupancy map Estimated GM PET image Map of relative contribution of WM to each PET voxel Predicted PET image of WM (virtual WM PET) Convolve 3 A B PVE corrected GM PET image Map of relative contribution of GM to each PET voxel A/B