Download
1 / 25
250 likes | 392 Views
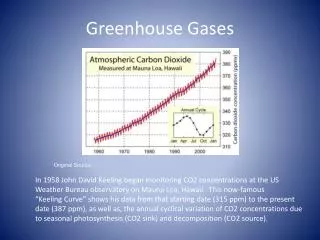
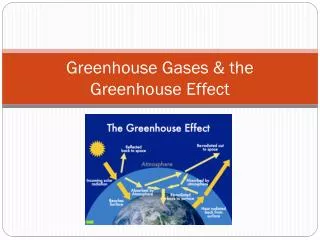
Satellite Sensing of Greenhouse Gases. By Cael Sutherland. (http://www.moline.il.us/departments/parks/NewGreenhouse.jpg). Greenhouse Gases. Carbon dioxide Hydrofluorocarbons Ozone Sulphur Hexafluoride Methane Nitrogen Trifluoride Nitrous oxide Fluorinated Ethers

E N D
Satellite Sensing of Greenhouse Gases By Cael Sutherland (http://www.moline.il.us/departments/parks/NewGreenhouse.jpg)
Greenhouse Gases Carbon dioxide Hydrofluorocarbons Ozone Sulphur Hexafluoride Methane Nitrogen Trifluoride Nitrous oxide Fluorinated Ethers CFCs Perfluoropolyethers HCFCs Dimethylether Carbon Tetrachloride Methylene Chloride Methyl Chloride (Manning, Qin, and Solomon, 2008)
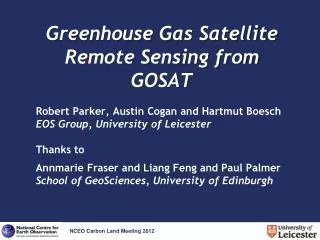
ERS-2 European Remote Sensing Altitude: 780 km Inclination: 98.5 degrees Repeat Cycle: 35 days Period: 100 min Swath Width: 120-960km (http://earth.esa.int/object/index.cfm?fobjectid=4004) (http://msl.jpl.nasa.gov/QuickLooks/ersQL.html) (http://www.ga.gov.au/remote-sensing/satellites-sensors/satellite-facts.jsp)
ERS-2 RA Radio Altimeter ATSR Sea and Cloud Temperature MWR Water Vapor Column SAR Ocean Surface Waves WS Wind Speed at Sea Surface PRARE Tracking And… (http://www.grdl.noaa.gov/SAT/pubs/papers/ers2_esm/fig1.jpg) (http://earth.esa.int/object/index.cfm?fobjectid=3978)
GOME Global Ozone Monitoring Experiment An instrument primarily created to measure ozone levels. It operates in the visual and ultraviolet wavelengths from 240 to 790 nm. Below 290 nm, GOME measures more that we know it should, so a calibration for the instrument is mandatory. Albedo, temperature, and Rayleigh scattering are also taken into account in the algorithm. (http://wdc.dlr.de/data_products/SERVICES/GOMENRT/ROSE/ images/current/r_o3p_ppm_HP.gif) (Burrows, Rozanov, Tellmann, & Weber, 2003)
GOME GOME uses the spectral band 240 to 790 nm because it contains two important ozone absorption bands, called the Hartley and Huggins bands. Using the Neural Networks Retrieval Algorithms, the combination of the two bands produces images such as the one to the right. (http://wdc.dlr.de/data_products/SERVICES/GOMENRT/ROSE/images/current/r_o3gmt56_SH.gif) (Casadioet al, 2007)
ENVISAT Altitude: 799.8 km Inclination: 98.55 degrees Repeat Cycle: 35 days Period: 100.59 min Velocity: 7.45 km/s Swath Width: 1000km max (http://envisat.esa.int/category/index.cfm?fcategoryid=61)
ENVISAT ASAR MERIS AATSR RA-2 MWR GOMOS MIPAS DORIS LRR And… Radar Altimetry Solar Reflectivity Sea Surface Temperature High Precision Altimeter Water Vapor Column Atmospheric Constituents Limb Gaseous Emmisions Microwave Tracking Laser Reflecter (http://www.asc-csa.gc.ca/images/recherche/images/ENVISAT-01_hr.jpg) (http://envisat.esa.int/object/index.cfm?fobjectid=3762)
SCIAMACHY SCanningImaging Absorption spectroMeter for Atmospheric CHartographY Is able to measure in three different observational geometries: Solar and Lunar Occultation RefractedLight Waves Limb Scanning All The Way To The Side Nadir Straight Down (Bovensmannet al, 2002)
SCIAMACHY Sample limb scanning data for ozone (http://www.iup.uni-bremen.de/~sciaproc/STROZONE/O3_2008.html)
Ozone 290-335nm (Casadio et al, 2007) (http://greenation.in/yahoo_site_admin/assets/images/ozone_formation.269181155.jpg)
SCIAMACHY (http://www.iup.uni-bremen.de/6jahresciamachy/eng/ueberwachungderozonschicht/index.html)
Carbon Dioxide Wavelengths: 1610 nm 2060 nm (http://trs-new.jpl.nasa.gov/dspace/ bitstream/2014/39959/1/06-2084.pdf) (http://benjyben.files.wordpress.com/2008/10/792px-camp_fire.jpg)
(http://www.iup.uni-bremen.de/sciamachy/NIR_NADIR_WFM_DOAS/)
(http://www.iup.uni-bremen.de/sciamachy/NIR_NADIR_WFM_DOAS/)
Methane 2265-2380nm (Buchwitz, Dobber, Goede, & Schrijver, 1998) (http://lilithsapothecary.files.wordpress.com/2009/08/seaweed.jpg)
(http://www.iup.uni-bremen.de/sciamachy/NIR_NADIR_WFM_DOAS/scia_ch4_nh_english.png)(http://www.iup.uni-bremen.de/sciamachy/NIR_NADIR_WFM_DOAS/scia_ch4_nh_english.png)
http://www.iup.uni-bremen.de/sciamachy/NIR_NADIR_WFM_DOAS/xch4_v1_2003-2005.png)http://www.iup.uni-bremen.de/sciamachy/NIR_NADIR_WFM_DOAS/xch4_v1_2003-2005.png)
Nitrogen Dioxide 425-450 nm (http://www.iup.uni-bremen. de/doas/no2_tropos_from_ scia.htm) (http://powermin.nic.in/ministry_of_power/generation_plants/thermal/images/A%20View%20of%20Badarpur%20Thermal%20Power%20Station.jpg)
(http://www.temis.nl/airpollution/no2col/no2colgome2.php?Year=2009&Month=11&Day=12)(http://www.temis.nl/airpollution/no2col/no2colgome2.php?Year=2009&Month=11&Day=12)
(http://www.iup.uni-bremen.de/~sciaproc/CDI/SSWF/NO2_2009.html)(http://www.iup.uni-bremen.de/~sciaproc/CDI/SSWF/NO2_2009.html)
References (2009, June 26). Australian government, geoscienceaustralia: satellite facts. Retrieved from http://www.ga.gov.au/remote-sensing/satellites sensors/satellite-facts.jsp Bovensmann, H, Burrows, J, Goede, A, Gotwald, M, Krieg, E, Muller, C, Noel, S, & Wuttke, M. (2002). Nadir, limb, and occultation measurements with sciamachy. Adv. Space Res., 29(11), 1819-1924. Buchwitz, M, Dobber, M, Goede, A, & Schrijver, H. (1998). Retrieval of carbon monoxide, methane, and nitrous oxide from sciamachy measurements. Optical Remote Sensing of the Atmosphere and Clouds, 3501, 215-224. Burrows, J, Rozanov, V, Tellmann, S, & Weber, M. (2003). Improvements in the tropical ozone profile retrieval from gome-uv/vis nadir spectra. Advances in Space Research, 34, 739-743. Casadio, S, Del Frate, F, Godin-Beekmann, S, Hansen, G, Iapaolo, M, Leblanc, T, McDermid, I, Meijer, Y, Petitdidier, M, Stebel, K, & Swart, D. (2007). Gome ozone profiles retrieved by neural network techniques: a global validation with lidar measurements. Journal of Quantitative Spectroscopy & Radiative Transfer, 107, 105-119. Crisp, D, Li, Q, Miller, C, Salawitch, R, Sen, B, & Toon, G. (n.d.). Using Sciamachy and ground based fts measurements to test the ocoxco2 retrieval and validation approach. Retrieved from http://trs-new.jpl.nasa.gov/dspace/bitstream/2014/39959/1/06-2084.pdf (2009). Esaearthnet online: envisat in depth overview. Retrieved from http://envisat.esa.int/category/index.cfm?fcategoryid=61 (2009). Esaearthnet online: envisat instruments. Retrieved from http://envisat.esa.int/object/index.cfm?fobjectid=3762 (2009). Esaearthnet online: ersintruments. Retrieved from http://earth.esa.int/object/index.cfm?fobjectid=3978 (2009). Esaearthnet online: gome in depth. Retrieved from http://earth.esa.int/object/index.cfm?fobjectid=4004 Manning, M, Qin, D, & Solomon, S. (2008). Technical summary. IPCC Report, 19-91. (2009). Mission and spacecraft library: quick look ers 1,2. Retrieved from http://msl.jpl.nasa.gov/QuickLooks/ersQL.html) Richter, A. (2008, August 8). University of bremeniupdoas: tropospheric no2 from sciamachy measurements. Retrieved from http://www.iup.uni bremen.de/doas/no2_tropos_from_scia.htm