Download
1 / 21
210 likes | 346 Views
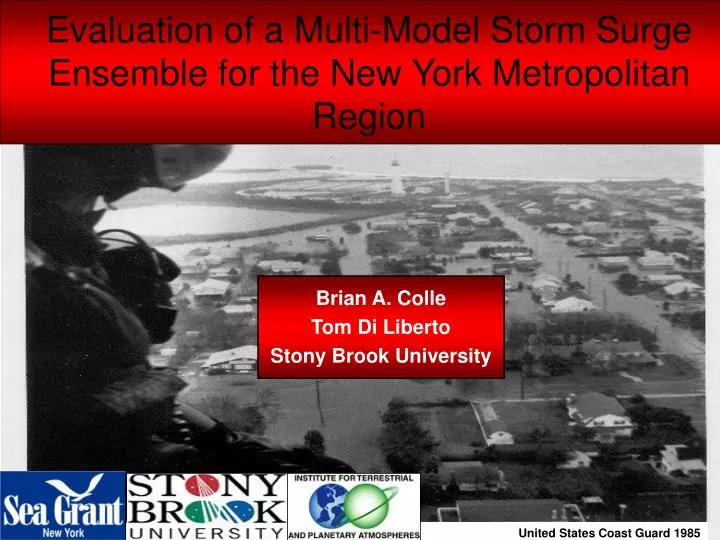
Evaluation of a Multi-Model Storm Surge Ensemble for the New York Metropolitan Region. Brian A. Colle Tom Di Liberto Stony Brook University. United States Coast Guard 1985. ADCIRC Water-level and Flooding. 12-km MM5 Forecast 1200 UTC 11 December 1992. ADCIRC Surge Forecast. meters.

E N D
Evaluation of a Multi-Model Storm Surge Ensemble for the New York Metropolitan Region Brian A. Colle Tom Di Liberto Stony Brook University United States Coast Guard 1985
ADCIRC Water-level and Flooding 12-km MM5 Forecast 1200 UTC 11 December 1992 ADCIRC Surge Forecast meters Colle, B. A., F. Buonaiuto, M. J. Bowman, R. E. Wilson, et al., 2008: Simulations of past cyclone events to explore New York City’s vulnerability to coastal flooding and storm surge model capabilities , Bull. Amer. Meteor. Soc.
Current Real-Time Systems Stony Brook Storm Surge Model http://stormy.msrc.sunysb.edu/ Stevens Institute of Technology’s Storm Surge model (NYHOPS) http://hudson.dl.stevens-tech.edu/maritimeforecast/ NOAA Extratropical Storm Surge model http://www.nws.noaa.gov/mdl/etsurge
Real-Time Modeling Systems All three models use different ocean models and atmospheric forcing. • Stony Brook Storm Surge Model (SBSS) uses 5 MM5 and 3 WRF members
Real-time Surge Model Grids SBSS Grid NOAA ET Grid SIT Grid Blumberg et al. 1999
Motivation for Storm Surge Ensembles 0000 UTC April 16th, 2007 – SLP (contour), Temp (shaded) and wind MM5 (GRMRF)-NAM WRF(GRYSU)-GFS WRF-GFS OBS MM5-NAM
Data and Methods Data: Nov. 2007 – March 2008 and Oct. 2008 – Dec. 2008 (75 in total) Deterministic: Mean Error, Root Mean Square Error Probabilistic: Rank (Talagrand) Histograms, Brier Score, Brier Skill Score and Reliability Diagrams • Bias correction was applied after the first month (Nov. 2007). • Use a regression approach of storm surge observations (> 0 and < 0 m) versus the storm surge mean error. • Use daily NCEP-NCAR reanalysis to look at the composite flow patterns associated with some of the errors.
Surge Mean Errors Bias Corr-ALL NOAA-ET SBSS ALL SIT Bias Corr-ALL NOAA-ET SIT
Surface Wind Speed Biases NCEP-NAM
Top 10 Largest Negative Error Days Days determined from calculating the largest 24-48 h negative mean error from the SBSS ensemble member 9a Largest negative error day is 11/04/2007 when an extratropical hurricane Noel impacted the region - 48 h - 24h Northeast winds occur 24 hours prior to large negative error Trough moves east/deepens 48 hours prior to large negative errors - 24 0 h
Potential Wave Impacts Significant Wave Height at buoy 44017 vs. 24-48 h Mean Error at Montauk Daily Mean Error, m Daily Averaged Significant Wave Height, m
Top 10 Largest Positive Error Days - 48 h - 24h Pressure gradient strengthens 24 hours prior to large negative error 0 h • Days determined from calculating the largest 24-48 h positive mean error from the SBSS ensemble member 9a • Largest negative error period was 12/23 – 12/26/2008
RMSE vs Forecast Hour NOAA-ET SBSS ALL SIT Bias Corr -ALL
Percentage Best and Worst WORST BEST NOAA-ET SIT NOAA-ET SBSS SBSS SIT
Rank Histogram ALL ALL-BC
Brier Scores vs Threshold SBSS ALL ENS3 ENS3-BC ALL-BC
Brier Skill Score (vs SBU CTL) ALL-BC ENS3-BC ENS3 ALL SBSS
Reliability Diagrams > 0.3 m Surge ALL SBSS SBSS ALL > 0.4 m Surge ALL SBSS
Reliability Diagram > 0.3 m Surge ALL SBSS ENS3 SBSS ALL ENS-3 > 0.4 m Surge SBSS ALL ENS3
Conclusions All surge models have a slight negative bias overall, which is largest in the NOAA-ET model. One can not use the last 7-14 days for bias correction, since bias depends on the sign of the surge. Stevens Institute (SIT) has greater deterministic accuracy (lower RMSEs) than all the SBSS MM5 and WRF ADCIRC members, which highlights the importance of adding different (and good) ocean models to the ensemble. The largest SBSS mean surge errors are dependent on the synoptic flow patterns. Positive surges with nor-easters are underpredicted on average, while offshore flow with an anticyclone to the west favors positive errors (underpredicted “blow-out” conditions). Most of the ensemble probabilistic skill and reliability originates from the three different ocean models on average, not from using one ocean model and multi-model atmospheric forcing (MM5 and WRF). Recommendation: In addition to coupling NOAA-ET to the SREF (NWS plans to do this soon), added skill can be obtained by also using different ocean (surge) models (ADCIRC, POM, ROMS, FVCOM, etc…).