Download
1 / 38
380 likes | 495 Views
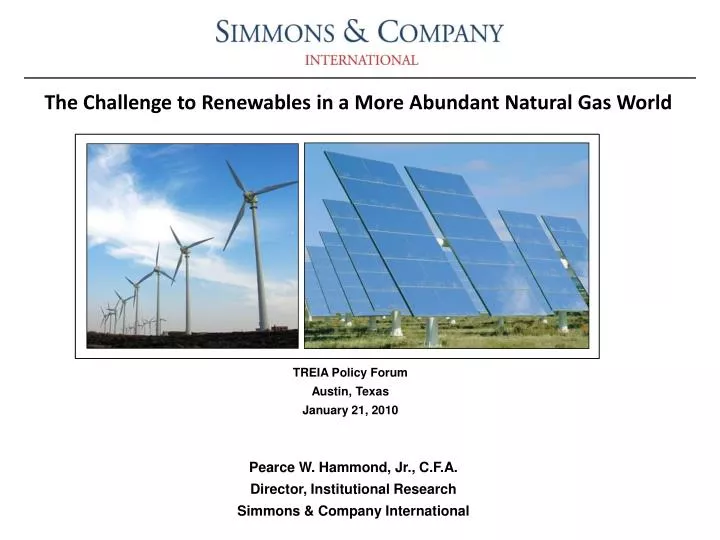
The Challenge to Renewables in a More Abundant Natural Gas World. TREIA Policy Forum Austin, Texas January 21, 2010. Pearce W. Hammond, Jr., C.F.A. Director, Institutional Research Simmons & Company International. Overview. Shale Gas Gas Supply Trends Impact to Renewable Energy

E N D
The Challenge to Renewables in a More Abundant Natural Gas World TREIA Policy Forum Austin, Texas January 21, 2010 Pearce W. Hammond, Jr., C.F.A. Director, Institutional Research Simmons & Company International
Overview • Shale Gas • Gas Supply Trends • Impact to Renewable Energy • Key Trends in Renewable Energy for 2010 • Conclusion • Q&A
Shale Gas: Driving Big Change in Energy Outlook • From the American Petroleum Institute. • Shale gas is defined as natural gas from shale formations. • Shale gas is an uncoventional gas source along with coalbed methane, tight sands and methane hydrates. • Shales ordinarily have insufficient permeability to allow meaningful flow to the well bore—therefore production requires fractures to improve permeability. • More recent shale wells are horizontal and need artificial stimulation, like hydraulic fracturing, to produce. • Significant advances in horizontal drilling and well stimulation technologies are leading to the shale boom. Hydraulic fracturing is the most significant of these. • Estimates of total natural gas resources in North America exceed 2,300 Tcf, with shale gas resources alone within this assessment accounting for over 500 Tcf of recoverable natural gas (combining U.S. and Canada). • In Apr ‘09 report, “Modern Shale Gas Development in the U.S.”, the U.S. DOE stated that the current recoverable resource estimate provides enough natural gas to supply the U.S. for the next 90 years. Other estimates carry this above 100 years.
Shale Plays • Big Four • Haynesville (LA, TX) • Likely to become one of the largest natural gas fields in the U.S. • Currently ~12% of U.S. shale gas production. • Marcellus (Northeast) • Likely to become one of the largest natural gas fields in the U.S. • Currently very small production. • Barnett (TX) • Largest producing field in the U.S. today and produces ~50-60% of all shale gas in the U.S. • Fayetteville (AR) • Currently ~18% of U.S. shale gas production. • Other Shale Plays: • Bakken • Fayetteville • Woodford • Horn River • Utica • Chattanooga • Huron
Validating the Shale: Two Recent Signature Transactions • ExxonMobil/ XTO Energy: • All share transaction. • $41 bn total value (includes $10 bn in debt). • Total/ Chesapeake: • CHK has agreed to sell a 25% interest in its upstream Barnett Shale assets to Total E&P USA for $9.0 bn. • CHK has also agree to discuss a JV in the Eagle Ford Shale with TOT and to work with TOT in evaluating several Canadian natural gas shale plays in which it has shown interest.
Shale Play Economics from CHK and XTO CHK Play Economics • Very high IRR’s—even at low nat gas prices. • Efficiencies and productivity should get better over time. • Big question is what are threshold economics? Source: CHK. XTO Play Economics Source: XTO.
Current Drilling Activity, Trends and Mix Shift • U.S. Gas directed rig count reached an all-time high on October 17, 2008 and has imploded ~50-60% from peak ’08 levels. • The majority of the rigs that were dropped were drilling vertical wells leading to a mix shift favoring more productive highly economic unconventional resource focused horizontal wells. • As a simple rule of thumb, horizontal wells have EURs that are 3x vertical wells and IP rates that are 4-5x vertical wells. U.S. Gas Directed Rig Count Graph of Rig Count Change by Well Type Source: Smith Bits Source: Smith Bits
Rig Count Breakdown and Unconventional Production Outlook Source: DOE Shale Gas Primer and SCI • Mix shift toward more economic and productive horizontal wells drove the recent production growth (~8% growth y/y) and is a trend we see increasing going forward. • Unconventional resource provide the market with an abundantly accessible inventory of gas that will be on the lower end of the cost curve insuring the ability to meet natural gas demand for the foreseeable future. • Prolific production from unconventional plays will likely reduce the required rigs, cycle to cycle, to keep production flat.
SCI estimates a 150 Gas-Directed Rig Increase from Trough by YE’10 based on a Partial Economic Recovery • Based on our rig driven gas supply model, we estimate production to decline in 1 Bcf/d by YE’09 and to decline by an additional 0.5 Bcf/d by June 2010. • Given an expectation for a partial recovery in the economy (gas demand begins to increase in 2010) coupled with declining production we anticipate the industry will need to add ~150 gas directed rigs to keep supply and demand in balance despite LNG imports and assuming normal weather. • Regardless of the economic scenario we employ, their will be a need to add anywhere from 100 to 500 rigs, but utilization will remain low with 1,000 or less rigs envisioned to be running in 2010 under our best case scenario. Well bellow the 1,600 peak in October 2009. Source: EIA, HPDI, SmithBits, Simmons & Company International.
Case Study: Southwestern Energy Efficiency Gains Source: SWN Quarterly Earnings Release, Fayetteville Shale.
U.S. Gas Production U.S. Nat Gas Production (Bcf/d) • U.S. natural gas production was 57.6 bcf/d in Oct ‘09. • Despite the steep drop in the rig count, the production in Oct ‘09 was down just 0.9 bcf/d from record 58.5 bcf/d in Feb ‘09. • Oct ‘07 production was 52.9 bcf/d. • In 2 years production grew by 4.7 bcf/d or 9%. Source: EIA.
LNG Liquefaction Additions Could be Significant in 2009/2010 Note: Projects are subject to further delays.
Key Nations Involved in LNG Trade 2008 LNG Imports by Country (bcfd) 2008 LNG Exports by Country (bcfd)
Does More Abundant Natural Gas Prevent Renewable Energy Adoption? • No. • Why? • Subsidy support • Gas compliments renewables. • Renewables produce little to no carbon. • Renewable Portfolio Standards. • Increasing EPA scrutiny of gas. • Crude-to-gas spread supports gas as a transportation fuel. • But, cheap natural gas does create a headwind for the sector.
Subsidy Support • LCOE for a combined cycle gas plant at $5.00/mmbtu gas with a $25/ton carbon price is $0.054/kwh. • Onshore wind is $0.06-$0.09/kwh. • Tough to compete for wind, but there is a subsidy (Production Tax Credit) of $0.021/kwh which help close the gap and mandates which stimulate demand. • In addition, there are opportunities to lower wind technology costs (as well as other alternative energy technologies) over time.
Gas Compliments Renewables • More abundant natural gas is much more a threat to coal and nuclear power both for new builds (coal, nuke) and existing capacity (coal). • In ‘09, the U.S. coal industry lost ~40 MM tons of demand (4% of ‘08 utility coal burn) due to lower priced natural gas. • Gas-fired generation can cycle up/down quickly making it ideal to compliment with intermittent renewable power generation.
Renewables Produce Little to No Carbon • While the global warming movement might be peaking (temporarily?), there is still a strong desire among citizens to have cleaner, more efficient forms of generation. • While gas produces less carbon than does coal, it still produces carbon.
Proposed Climate Legislation: U.S. CO2 Emissions • The Waxman Bill calls for a 17% reduction of greenhouse gases (GHG) from ‘05 levels by 2020. • In 2005, U.S. energy-related CO2 emissions were 5,975 MM tonnes. Therefore, the Waxman Bill is calling for energy-related CO2 emissions to reach 4,960 MM tonnes by 2020 (-1.2% CAGR). • Total emissions of U.S. GHG were 7,282 MM tonnes in 2007. Energy-related CO2 emissions accounted for 81% of that total. • Between 1988-2008, U.S. CO2 emissions increased to 5,802 MM tonnes from 4,993 MM tonnes (0.75% CAGR). • Electricity accounts for 41% of U.S. CO2 emissions with coal 81% of total electricity-related CO2 emissions. U.S. Energy-Related CO2 Emissions 2007 U.S. CO2 Emissions by End Use U.S. Electricity CO2 Emissions Source: EIA. Source: EIA. Source: EIA.
Proposed Climate Legislation: Impact to Alternative Energy • What is the impact from a combined nationwide RES and climate bill? • In the first scenario, we assumed that non-hydro renewables increased their share from 3% currently to 15%. Moreover, we assumed that the U.S. reached the 17% CO2 reduction target. • The impacts: • Coal’s share of U.S. electricity would decline from 49% currently to 32% (2.4% per annum decline between ’07-’20). • Natural gas’ share of U.S. electricity would increase to 29% from 21% and this would result in incremental gas demand (from ’07 levels) of 10.6 bcf/d. • Non-hydro renewable capacity would increase from 46 GW to 264 GW or 218 GW of incremental capacity. This represents a staggering 19.8 GW per annum of additional capacity over the next 11 years. To place this figure in perspective, the U.S. wind industry installed a record 8.4 GW of turbines in 2008. • Under all scenarios that we ran, renewables increased share and natural gas demand increased. • Keep in mind that running the existing U.S. combined cycle fleet at a 60% capacity factor (instead of 38%) could result in 8.1 bcf/d of incremental gas demand. Scenario One: 2020 Generation with 15% Renewable Assumption – Reaching 17% CO2 Reduction Source: EIA , SNL Energy and Simmons & Co. International.
Carbon Legislation: Impact to Merchants Fuel Mix by Region IPP Carbon Intensity • For coal fired generators that operate in markets where gas sets the price of power (NRG in Texas, Mirant in PJM East, and RRI in Central PJM), carbon legislation has the potential to significantly reduce margins. • If carbon legislation is stringent enough, combined cycle assets have the ability to displace coal fired capacity especially in the Southeast. • In markets where high heat rate combustion turbine (CT) gas assets often set the price of power, efficient CCGT gas assets should see a benefit in spark spreads. • CPN benefits from stringent carbon legislation Carbon Intensity by Fuel Type Current legislation passed in the House is extremely favorable to coal based merchants and should cause minimal earnings detriment over the next decade.
Renewable Portfolio Standards www.dsireusa.org / January 2010 WA: 15% by 2020* ME: 30% by 2000 New RE: 10% by 2017 VT: (1) RE meets any increase in retail sales by 2012; (2) 20% RE & CHP by 2017 MN: 25% by 2025 (Xcel: 30% by 2020) MT: 15% by 2015 • NH: 23.8% by 2025 ND: 10% by 2015 MI: 10% + 1,100 MW by 2015* • MA: 15% by 2020+ 1% annual increase(Class I Renewables) • OR: 25% by 2025(large utilities)* 5% - 10% by 2025 (smaller utilities) SD: 10% by 2015 WI: Varies by utility; 10% by 2015 goal • NY: 24% by 2013 RI: 16% by 2020 CT: 23% by 2020 • NV: 25% by 2025* IA: 105 MW • OH: 25% by 2025† • CO: 20% by 2020(IOUs) 10% by 2020 (co-ops & large munis)* • PA: 18% by 2020† WV: 25% by 2025*† • IL: 25% by 2025 • NJ: 22.5% by 2021 CA: 33% by 2020 UT: 20% by 2025* KS: 20% by 2020 VA: 15% by 2025* • MD: 20% by 2022 • MO: 15% by 2021 • AZ: 15% by 2025 • DE: 20% by 2019* • NC: 12.5% by 2021(IOUs) 10% by 2018 (co-ops & munis) • DC: 20% by 2020 • NM: 20% by 2020(IOUs) • 10% by 2020 (co-ops) TX: 5,880 MW by 2015 29 states & DChave an RPS 6 states have goals HI: 40% by 2030 State renewable portfolio standard Minimum solar or customer-sited requirement * State renewable portfolio goal Extra credit for solar or customer-sited renewables † Solar water heating eligible Includes non-renewable alternative resources
Increased EPA Scrutiny of Gas • Hydraulic fracturing has come under pressure. • Water usage is also a concern. • Look for the coal lobby to strike back.
Crude-Gas Spread Supports Gas as a Transportation Fuel • Compressed natural gas is cheaper than diesel and gasoline. • Retail pump prices for CNG total $2.00/GGE (gallon of gasoline equivalent) in Houston and even lower in other parts of the country where stations or pipeline natural gas is more available. • This compares with retail gasoline at $2.67/gal. • The spread of $0.67/GGE or 25% discount is enticing and falls just short of the average discount for CNG over the last 4.5 years of 28%. • Potential: if 10% of the total regional trucking fleet in the U.S. switched to natural gas, this would equate to 3 bn GGE’s annually or 1 Bcf/d of incremental demand.
Alternative Energy: Key Trends for 2010 • No carbon bill in D.C., but maybe an energy bill. • More robust capital markets. • Consolidation • Better demand and financing. • Higher interest rates
Conclusion • Shale gas appears to be a significant change to the energy landscape. • More abundant natural gas does make it more difficult to adopt renewables, but it does not prevent adoption. • More abundant natural gas ultimately is a headwind for the renewable energy sector. • There are complimentary adoption strategies for renewables and natural gas: bridge fuel to lower carbon era and solution for renewable intermittency. • We believe it is of paramount importance that investors focus on those alternative energy technologies that illustrate the clearest path to becoming economic without a subsidy.
Technology Cost Comparison Non-Subsidized Levelized Cost of Electricity Source: EIA, IEA, Simmons & Co. International.
Wind: Growth Forecast Global Wind Installed Capacity Growth • 2009 growth stunted – market expectations -5% to +5% y/y. • We believe ‘09 will be down y/y to 25 GW, ‘10 could be start of next multi year ramp. Slightly slower growth rate: ~20% per annum moving forward instead of 25%. • 5-year growth projections – doubling of annual market • Grid dependent growth to ~900 GW by 2018 (8% of global electric needs) • U.S. Market Factors: RES, PTC extension, Obama energy policy • Global Market Factors: Industry dealing with turbine over-supply, EU 20% by 2020, China explosive growth, transmission is a great challenge. Source: BTM Consult. Wind Sector Demand Overview (in MW) Source: Global Wind Energy Council and BTM Consult
2010 Solar Outlook • We expect a relatively strong 1H’10 as installers rush to get German projects on the ground ahead of the speculated EEG decline. Overall, 2010 should be a better year than 2009. • Supply/Demand: We are estimating 8.4 GW (+45% y/y) of module demand in 2010 with 13 GW of potential supply. • ASPs: We estimate mid-$1.00/W by the end of 2010 for wholesale module prices. Some recent contracts have been between $1.60-$1.75/W. • Key Market to Watch: Germany with EEG revision.
Current U.S. Generation Mix • Waxman Bill has Nationwide Renewable Electricity Standard (RES) that calls for 20% of U.S. electricity to come from non-hydro renewable sources by 2020. However, 5 percentage points can be met through energy efficiency leaving an effective RES of 15%. • In 2007, just 3% of U.S. electricity was from non-hydro renewable sources. 2008 U.S. Generation by Fuel 2008 U.S. Net Renewable (Non-Hydro) Electrical Generation Source: IEA Source: IEA
Appendix D • Appendix D • Analyst Certification: I, Pearce Hammond, hereby certify that the views expressed in this research report to the best of my knowledge, accurately reflect my personal views about the subject compan(ies) and its (their) securities; and that, I have not been, am not, and will not be receiving direct or indirect compensation in exchange for expressing the specific recommendation(s) or views in this research report. Important Disclosures: For detailed rating information, go to http://publicdisclosure.simmonsco-intl.com. Additional information is available upon request. Simmons & Company's ratings system categorizes individual stock performance as Underweight, Neutral or Overweight relative to the performance of the S&P 500 Index and its discrete energy sub-sector over a 12 month period. Research analysts compensation is based upon (among other things) the firm's general investment banking revenues. Simmons & Company International may seek compensation for investment banking services from other companies for which research coverage is provided. The firm would expect to receive compensation for any such services. Foreign Affiliate Disclosure: This report may be made available in the United Kingdom through distribution by Simmons & Company International Capital Markets Limited, a firm authorized and regulated by the Financial Services Authority to undertake designated investment business in the United Kingdom. Simmons & Company International Capital Markets Limited's policy on managing investment research conflicts is available by request. The research report is directed only at persons who have professional experience in matters relating to investments who fall within the definition of investment professionals in Article 19(5) Financial Services and Markets Act (Financial Promotion) Order 2001 (as amended) ("FPO"); persons who fall within Article 49(2)(a) to (d) FPO (high net worth companies, unincorporated associations etc.) or persons who are otherwise market counterparties or intermediate customers in accordance with the FSA Handbook of Rules and Guidance ("relevant persons"). The research report must not be acted on or relied upon by any persons who receive it within the EEA who are not relevant persons. Simmons & Company International Capital Markets Limited is located at Sackville House, 40 Piccadilly, Mezzanine, London, United Kingdom. Disclaimer: This e-mail is based on information obtained from sources which Simmons & Company International believes to be reliable, but Simmons & Company does not represent or warrant its accuracy. The opinions and estimates contained in the e-mail represent the views of Simmons & Company as of the date of the e-mail, and may be subject to change without prior notice. Simmons & Company International will not be responsible for the consequence of reliance upon any opinion or statement contained in this e-mail. This e-mail is confidential and may not be reproduced in whole or in part without the prior written permission of Simmons & Company International.