Download
1 / 15
150 likes | 239 Views
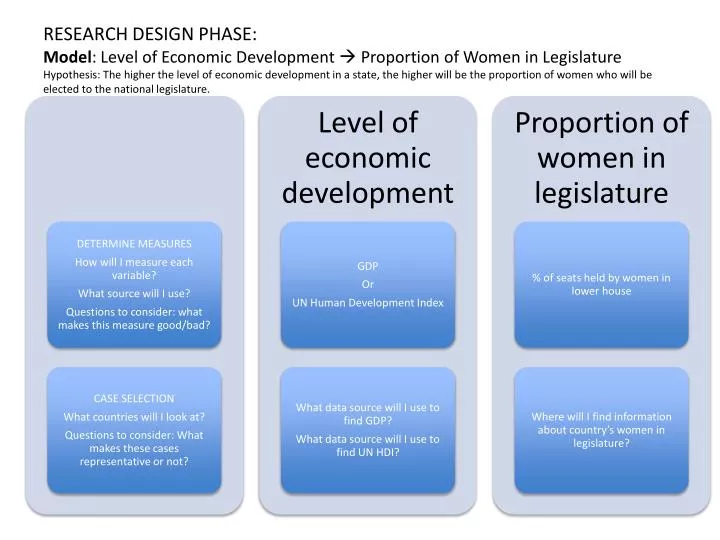
RESEARCH DESIGN PHASE: Model : Level of Economic Development Proportion of Women in Legislature Hypothesis: The higher the level of economic development in a state, the higher will be the proportion of women who will be elected to the national legislature.

E N D
RESEARCH DESIGN PHASE:Model: Level of Economic Development Proportion of Women in LegislatureHypothesis: The higher the level of economic development in a state, the higher will be the proportion of women who will be elected to the national legislature.
RESEARCH DESIGN PHASE:Model: Governing Institutions Democratic StabilityHypothesis: The stronger the governing institutions, the greater will be the level of democratic stability.
RESEARCH DESIGN PHASE:Model: IV DVHypothesis: The more/less of IV, the more less of the DV.
The stronger the governing institutions, the greater will be the level of democratic stability.
Analysis and Assessment Hypothesis Research Design Comparative case study of Salvadoran politics Compare postwar period, 1992-1997 to recent past: 2005-2010 The stronger the governing institutions, the greater will be the level of democratic stability. DV = level of democratic stability
Analysis and Assessment Hypothesis Research Design DV = Stability = using Freedom House data, rank of 1-7 to determine whether it has improved IV = Strength of state institutions Power of 2 major parties Ability of military and police to do jobs Ability of economy to provide “living wage” The stronger the governing institutions, the greater will be the level of democratic stability. DV = level of democratic stability IV = Strength of state institutions
Analysis and Assessment Research Design Research Design • DV = Stability = using Freedom House data, rank of 1-7 to determine whether it has improved • IV = Strength of state institutions • Power of 2 major parties • Ability of military and police to do jobs • Ability of economy to provide “living wage”
The stronger the governing institutions, the greater will be the level of democratic stability.
Quantitative Analysis • Hypothesis • Democrats more likely than Republicans to favor 2010 health care reform bill. • Independents less likely than Democrats, more likely than Republicans to view bill favorably.
Research Design Hypothesis • Democrats more likely than Republicans to favor 2010 health care reform bill. • Independents less likely than Democrats, more likely than Republicans to view bill favorably. • Survey students on campus in intro social science class • Ask party affiliation • Ask views on HC I consider myself a … • Democrat • Republican • Independent/Other My attitude toward 2010 HC Reform Bill • Favorable • Unfavorable • Don’t know
Party Affiliation and Support for Health Care Reform Calculate the Chi Square value: Tells you extent to which your observations are different from what you would expect if there were no relationship between the IV and the DV. In this case, it is significant greater than the .001 level, so we are confident that 99.9% of the time party affiliation is a predictor of attitudes toward 2010 HC reform bill.
Regression • Hypothesis: Higher levels of economic development, higher percentage of females in legislature. • Test — control for culture; select subset of states with similar values.
Putting It Altogether Conclusion Introduction Communicates research question Explains why this matters … answers the “who cares” question Indicates the cases you are studying Provides road map to your paper • Ties paper together • Repeats argument, reports findings • Reminds reader why argument is important to different audiences • Assesses extent to which thesis can be extended or limited • Returns to choices or compromises made • Establishes productive path for future research