Download
1 / 24
270 likes | 336 Views
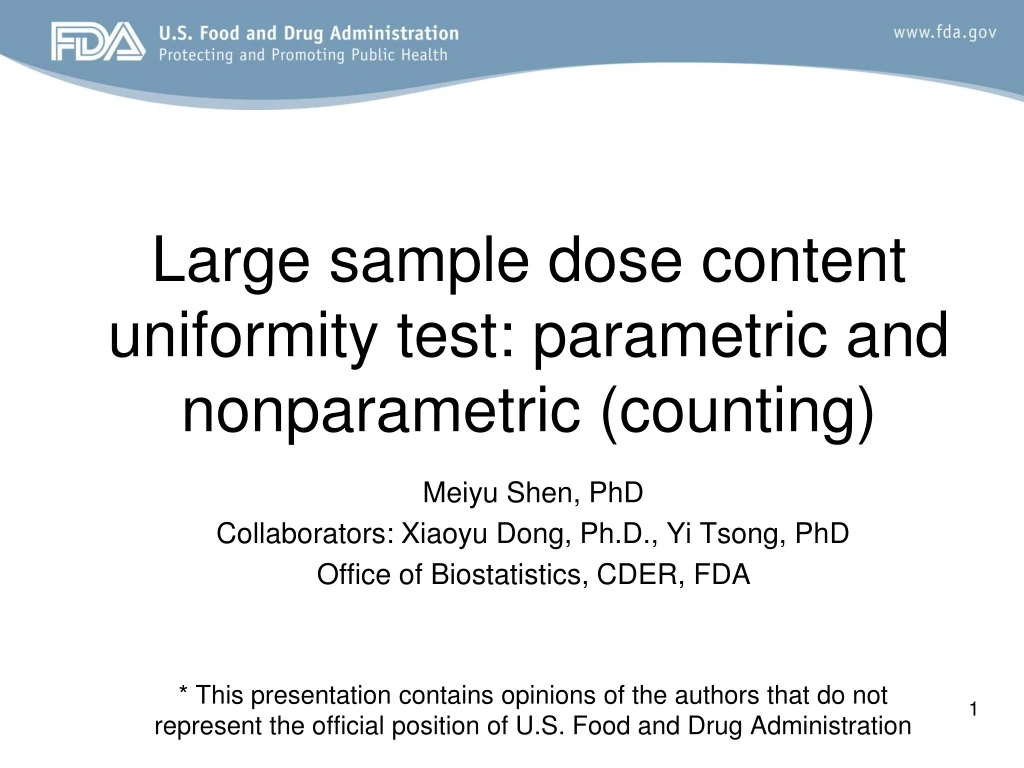
Large sample dose content uniformity test: parametric and nonparametric (counting). Meiyu Shen, PhD Collaborators: Xiaoyu Dong, Ph.D., Yi Tsong, PhD Office of Biostatistics, CDER, FDA

E N D
Large sample dose content uniformity test: parametric and nonparametric (counting) Meiyu Shen, PhD Collaborators: Xiaoyu Dong, Ph.D., Yi Tsong, PhD Office of Biostatistics, CDER, FDA * This presentation contains opinions of the authors that do not represent the official position of U.S. Food and Drug Administration
Outline • Purpose of uniformity of dosage unit • Harmonized USP dose content uniformity test with a small sample • Large n dose content uniformity test • EU methods • Option 1: Parametric method • Option 2: Nonparametric method (Counting method) • Two one-sided tolerance interval method • Comparison between the EU method and the two one-sided tolerance interval method • Conclusion
Uniformity of dosage unit • The purpose of uniformity of dosage unit • The degree of uniformity in the amount of the drug substance among dosage units. • Demonstrated by one of the follows • Dose content uniformity (focus here) • based on the assay of the individual content of drug substance(s) in a number of dosage units • Weight variation
Indifferent zone • M:
Harmonized USP DCU for small n Step 1, 10 tablets Step 2, additional 20 tablets No Yes Fail Yes Pass Pass
EU option 1 for large n≥100 Take n tablets, {Xi}, i=1,2,…,n No Fail Yes 6 Pass
EU option 2 for large n≥100 Take n tablets, {Xi}, i=1,2,…,n No Fail Yes Pass 7
EU Option 2 acceptable number of individual units c1 outside (1±0.15) and c2 outsides (1±0.25)
PTIT_matchUSP90 Take n tablets, {Xi}, i=1,2,…,n No Fail Yes Pass 9
EU option 1 and PTIT_matchUSP90 EU Option 1 PTIT_matchUSP90 Two one-sided tolerance interval Control probability each tail outside (85,115)% Two one-sided hypothesis • Two-sided tolerance interval • Control probability within (85,115)% • Two-sided hypothesis P (1-P)/2
EU option 1 and PTIT_matchUSP90 EU Option 1 PTIT_matchUSP90 Formula for K Confidence level: 1-α=0.95 Each tail probability: (1-p(n))/2 For n=30, p=82.04%, • Formula for K • Confidence level: • Center Coverage:
Special distribution • Assume the individual tablet dose content is distributed as a uniform distribution in the range from 85% to 115% with 97% probability and a value 84% with 3% probability. • The probability of passing USP harmonized DCU is 3.72% for a sample size of 30 tablets. • Comparison of EU Option 2 and PTIT_matchUSP90 in next table • EU Option 2 has 45.5% probability to pass the DCU test when n=300. • the PTIT_macthUSP90 has zero passing probability for n≥100.
EU Option 2 and PTIT_matchUSP90 Xi: a uniform distribution in the range from 85% to 115% with 97% probability and a value 84% with 3% probability
Conclusion • A large difference in acceptance probability between EU option 1 and PTIT_matchUSP90 when the batch mean is off-target. • Larger passing probability for EU Option 1 than PTIT_matchUSP90 • No much difference in acceptance probability between EU option 1 and PTIT_matchUSP90 when the batch mean is on-target. • Bias of EU Option 1 • EU Option 1 has higher probability of passing the off-target product than that of passing the on-target mean product for a given coverage within (85%, 115%)
Conclusion (continued) • EU Option 2 • Issue with a large variability for a mixture of 97% probability of distributing uniformly with (85%, 115%) and 3% probability of being 84%) using a sample of 200 • 60% probability to pass EU Option 2 • 0% probability to pass PTIT_matchUSP90 • 3% probability to pass USP harmonized • Issue with a location shift of the mean product • The same probability to pass the EU Option 2 for 97% population with 100% content and 97% population with 90% content. • Off target product: 97% population with 90% content using a sample of 150. • >50% probability to pass the EU Option 2 • About 1% probability to pass PTIT_matchUSP90
References • USP Pharmacopoeia 2015 • European Pharmacopoeia 7.7 • European Pharmacopoeia 8.1 • Meiyu Shen, Yi Tsong, Xiaoyu Dong, Statistical Properties of Large Sample Tests for Dose Content Uniformity, Therapeutic Innovation & Regulatory Science, 2014, Vol. 48(5) 613-622 • Meiyu Shen and Yi Tsong, Bias Of The United States Pharmacopeia Harmonized Test For Dose Content Uniformity, United States Pharmacopeia forum, January 2011