Download
1 / 11
110 likes | 176 Views
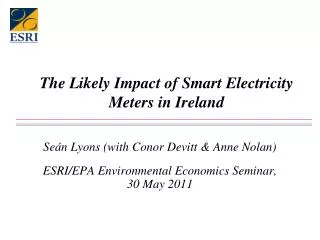
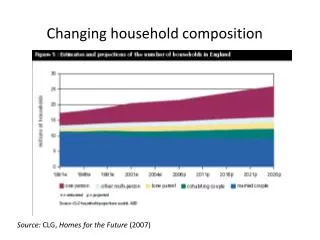
Exploration of electricity usage data from smart meters to investigate household composition. Topic (v): Integration and management of new data sources Seminar on Statistical Data Collection Geneva, Switzerland, 25-27 September 2013. Paula.Carroll@ucd.ie John.Dunne@cso.ie

E N D
Exploration of electricity usage data from smart meters to investigate household composition Topic (v): Integration and management of new data sources Seminar on Statistical Data Collection Geneva, Switzerland, 25-27 September 2013 Paula.Carroll@ucd.ie John.Dunne@cso.ie Michael.Hanley@ucdconnect.ie Tadhg.Murphy.1@ucdconnect.ie
Overview • Setting the scene • The data • Problem statement • The methodology • Some results • The resources • Team review • CSO review • Concluding remarks
The data • Over 5000 households in pilot • 3 months baseline data (reading every 30 mins) • Pre-trial survey using CATI Purpose : Consumer Behaviour Trials in 2009 and 2010
Problem statement To determine household composition using smart metering data
The methodology • Machine learning algorithms for classifier • (learning and testing || generalisation) • Neural Networks used • Binomial and Multinomial classification • Unbalanced data • Data reduction/ dimension reduction • Used 21 explanatory variables as input to classifier • Variables normalised
Some results – balanced multinomial classifier “Confusion matrix”
The resources • Project team of two persons for 3 months • Significant amount of time spent manipulating data • Software: R with nnet and neuralnet packages • Hardware: Required considerable computer resources for manipulating full dataset (Stokes at ICHEC)
Team review Problem statement too specific - broaden to household characteristics Alternative approach (cluster analysis and then describe clusters) Other techniques – PCA or signal processing
CSO review – forward looking Assuming go live 1.5m household meters linked to statistical household register in 2019 Existing statistical needs • Field force management • Auxiliary information • Sample selection /Representivity analysis New statistical products? • Energy consumption patterns by location, household etc • Quality of life (time to rise, time to bed)
Concluding remarks 3 V’s + V for Value – Is there value in SMD Access v Privacy • Legal, moral, proportionality Infrastructure for Big data (1.5m data points every 30 mins) • Outsourcing, downsampling New tools, skills, approaches Roadmap – collaboration with suitable partners