Download
1 / 26
260 likes | 271 Views
Examining Changes in Forest Ecosystem Carbon Exchange with Stand Age in the Upper Midwest US. Old. &. Not So Old. Ankur Desai, Ken Davis, Weiguo Wang Department of Meteorology Pennsylvania State University Paul Bolstad, Eileen Carey, Bruce Cook

E N D
Examining Changes in Forest Ecosystem Carbon Exchange with Stand Age in the Upper Midwest US Old & Not So Old Ankur Desai, Ken Davis, Weiguo Wang Department of Meteorology Pennsylvania State University Paul Bolstad, Eileen Carey, Bruce Cook Jon Martin, Leslie Kreller, Deborah Hudleston Department of Forest Resources University of Minnesota
Acknowledgements • Department of Energy • Office of Biological and Environmental Research, Terrestrial Carbon Processes • National Institute for Global Environmental Change (NIGEC) – Midwestern Region • Ameriflux / Fluxnet • U.S. Forest Service • Chequamegon-Nicolet National Forest, Park Falls, WI • Ottawa National Forest, Watersmeet, MI • North Central Research Station, Rhinelander, WI
Motivation • While interannual variability in forest carbon exchange appears to be primarily controlled by climate, long-term forest carbon exchange is strongly constrained by stand age since initiation • Scaling carbon fluxes across space and time (past or future) requires understanding of the relationship between forest carbon exchange and site age • Eddy flux measurements in old-growth forests are few but increasing. None are in the upper Midwest • Old growth forests are expanding in the upper Midwest • Old growth forests are not carbon neutral as was typically theorized, but are probably small carbon sinks
ChEAS Region • Chequamegon-Ecosystem Atmosphere Study allows for intensive study of carbon exchange • Most forests in region arerecovering from logging in early 20th century • Pre-European settlement vegetation is found in the 8,500 Ha Sylvania Wilderness and Recreation area (Upper Peninsula, Michigan) • Eddy flux towers have been installed in an old growth stand adjacent to Sylvania and a nearby mature hardwoods forest (Willow Creek)
Hypotheses • Ecosystem respiration is greater at an old-growth forest compared stand to a mature forest stand • Primarily due to increased coarse woody debris • Gross ecosystem production is slightly lower at the old-growth site compared to the mature site • Possibly due to decreased light use efficiency, stomatal conductance, water use efficiency and/or hydraulic conductivity • The old-growth site is more sensitive to drought stress
Site Descriptions • Sylvania old-growth • Established late 2001 • Hemlock, sugar maple, basswood, yellow birch, LAI: 3.6 • 0-350 year old trees, very low disturbance frequency (5.4% / decade), long-term compositional equilibrium • Lots of coarse woody debris (42 Mg/Ha) • 3-30 Ha patchy regions of s. maple or hemlock dominance • Willow Creek mature hardwoods • Established mid-1998 • Sugar maple, basswood, green ash, LAI: 5.3 • Approx. 70 yrs old (initiated after logging) • Very little coarse woody debris
Site Descriptions • Willow Creek pre-European settlement vegetation is very similar to Sylvania
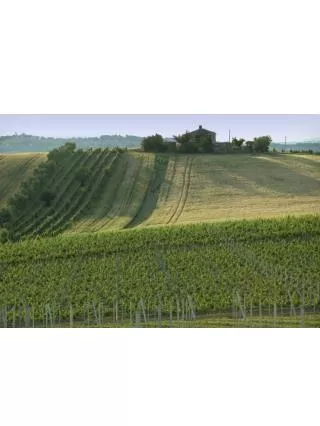
Site Descriptions Willow Creek Sylvania
Climate • Average (1971-2000, Watersmeet, MI) • Annual: 3.9o C, -12.7o C in Jan, 18.5o C in Jul • 771 mm of precipitation (57% during May-Sep) • Willow Creek is slightly colder and drier (esp. in winter) • 2002 • Warmer: 5.0o C, -7.1o C in Jan, 20.7o C in Jul • Wetter: 866 mm, but very dry in Nov and Dec • 2003 • Colder up through Oct: -14.3o C in Jan, 18.0o C in Jul • Very dry winter and spring (50% of average precip.) • August-October also dry (59% of average precip.) • Soil moisture lower than 2002 in Jan-Mar and Jul-Sep
Methods • Eddy covariance measurements and high-precision CO2 mixing ratio profiles measured from 30 m (W Creek) and 37 m (Sylvania) towers, 10 hz, similar instrumentation (closed-path IRGAs) and flux calculation methods • Standard micrometeorological and soil measurements and profiles (temperature, water, radiation, etc…) • Ground-based biometric and physiological measurements in vicinity of towers and across ChEAS region, including soil efflux
Methods • Nighttime u* cutoff filter • 0.3 m s-1 at Sylvania • 0.175 m s-1 at Willow Creek • Directional heterogeneity NEE data screening • non-SW winds on summer nights at Sylvania (dilution by lakes?) • SE-winds (typically with temperature inversions) at Willow Creek (flux pooling in low-lying wetland?)
Methods • Ecosystem respiration (ER) modeled with nighttime NEE and 5-cm soil temperature • Using an Arrhenius style equation • 28-day moving window fit • GEP computed as ER – NEE • Light response curves modeled with daytime GEP and above canopy incoming total PAR • Rectangular hyperbola curve • Similar moving window fit as for ER • Data gaps filled using ER and GEP models • 2003 results are preliminary (computed last week!)
Average Daily NEE (Jun-Aug) • Mean nighttime summer NEE at Willow Creek was smaller than Sylvania; nighttime NEE decreased at Sylvania in 2003 vs. 2002, but not at Willow Creek • Mean daytime summer NEE at Willow Creek was larger than Sylvania; daytime NEE was similar in `02 and `03
Net Ecosystem Exchange • Total summer (Jun-Aug) NEE at Willow Creek was larger than Sylvania; 244% larger in 2002, 181% in 2003 • Summer Sylvania NEE increased 60% in 2003 vs. 2002, while Willow Creek NEE increased 30% gC m-2 day-1 gC m-2 day-1
Cumulative NEE • Annual total NEE in 2002 at Willow Creek (-447 gC m-2 yr-1) was much larger than Sylvania (-72 gC m-2 yr-1) • 2003 is also on target for a large difference; up through September, NEE Jan-Oct 2003 at Willow Creek (-701 gC m-2 yr-1) was 1.75x larger than Sylvania (-254 gC m-2 yr-1). Total uptake appears to be larger in 2003 vs. 2002
Respiration Response • Sylvania had a greater temperature dependency (dR/dT) to respiration than Willow Creek • Respiration for a given temperature decreased slightly for Sylvania, but increased for Willow Creek in 2003 • Summer soil temperature was ~1.2 C cooler in 2003
Total Ecosystem Respiration • Summer respiration at Willow Creek was smaller than Sylvania; 41% smaller in 2002, 24% in 2003 • Summer Sylvania respiration decreased 26% in 2003 vs. 2002, whereas Willow Creek declined only 3% Total: Sylvania (965 gC m-2 yr-1) Willow Creek (667 gC m-2 yr-1) gC m-2 day-1 gC m-2 day-1
Soil Chamber Efflux • Sylvania • Total 2002 soil respiration was 908 gC m-2 yr-1 = 94% of total ecosystem respiration (965 gC m-2 yr-1) • Mean summer soil respiration was 3.9 mmol m-2 s-1 = 57% of mean summer eddy flux respiration (6.8 mmol m-2 s-1) • Willow Creek • Total 2002 soil respiration was 1147 gC m-2 yr-1 = 172% of total ecosystem respiration (667 gC m-2 yr-1) • Mean summer soil respiration was 7.0 mmol m-2 s-1 = 175% of mean summer eddy flux respiration (4.0 mmol m-2 s-1)
Daytime PAR Response • GEP to PAR response was slightly smaller at Sylvania than Willow Creek in 2002; bigger difference in 2003 • Willow Creek response curves were relatively similar in 2002 and 2003; Sylvania was smaller in 2003 vs. 2002
Total Ecosystem GEP • Summer GEP at Willow Creek was slightly larger than Sylvania; 15% larger in 2002; 46% in 2003 • Summer Sylvania GEP declined 7% in 2003 vs 2002, whereas Willow Creek GEP increased 17% Total: Sylvania (1036 gC m-2 yr-1) Willow Creek (1136 gC m-2 yr-1) gC m-2 day-1 gC m-2 day-1
GEP:ER • Mean daily GEP:ER ratio for summer (Jun-Aug)
WUE • Ratio of mean monthly GEP (gC m-2 day-1) : LE (kg H2O m-2 day-1) • Significant change from 2002 to 2003 at Willow Creek • LE decreased significantly in summer at Willow Creek, but not at Sylvania from 2002 to 2003
Summary • Ecosystem respiration at Sylvania appears to be more sensitive to climate than Willow Creek. Both Willow Creek and Sylvania had significant GEP interannual variability, though more at Willow Creek • The two sites had opposite responses in summer GEP when comparing 2002 to 2003 • Total annual NEE at both sites was larger in a cool, dry year (2003) compared to a warm, wet year (2002) • This NEE increase was driven at Sylvania mainly by ecosystem respiration decline, but at Willow Creek, the increase was due to an increase in GEP
Summary • Chamber soil efflux suggests opposite respiration differences between the two sites than eddy flux • CWD respiration calculations underway • GEP:ER increased slightly at both sites in 2003 compared to 2002 • WUE increased at Willow Creek in 2003 vs. 2002 • Sapflux data can be used to separate evaporation and transpiration to find source of WUE change • Had Willow Creek never been logged or managed, it probably would have much larger ecosystem respiration (most likely due to greater CWD), and slightly or moderately smaller gross ecosystem production
Future Work • Analysis of biometric and physiological measurements to calculate NEP and individual carbon pool fluxes • BIOME-BGC modeling of carbon exchange • Integration of remote sensing / FIA data to extrapolate fluxes over the region • More information at http://cheas.psu.edu