Download
1 / 10
100 likes | 160 Views
AS Module 2. The Demographic Transition Model. A Simple explanation of how it works. What is the basic idea?.

E N D
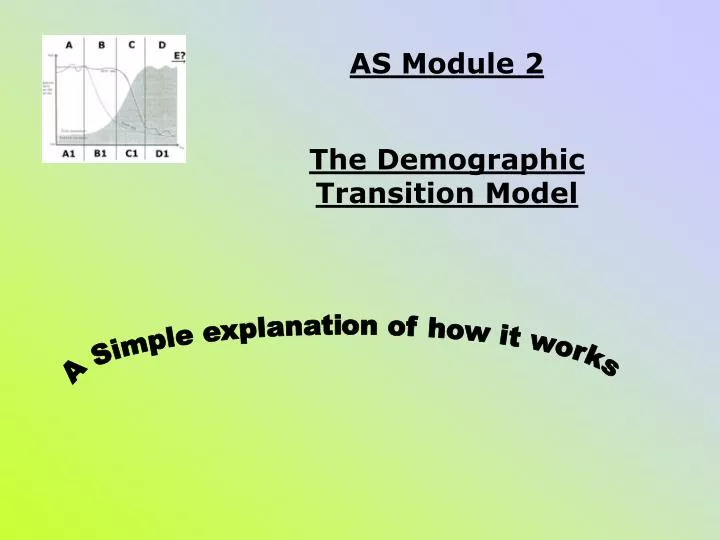
AS Module 2 The Demographic Transition Model A Simple explanation of how it works
What is the basic idea? The demographic transition model seeks to explain the transformation of countries from having high birth and death rates to low birth and death rates. In developed countries this transition began in the eighteenth century and continues today. Less developed countries began the transition later and are still in the midst of earlier stages of the model.
CBR and CDR The model is based on the change in crude birth rate (CBR) and crude death rate (CDR) over time. Each is expressed per thousand population. The CBR is determined by taking the number of births in one year in a country, dividing it by the country's population, and multiplying the number by 1000. In 1998, the CBR in the USA is 14 per 1000 (14 births per 1000 people) while in Kenya it is 32 per 1000. The crude death rate is similarly determined. The number of deaths in one year are divided by the population and that figure is multiplied by 1000. This yields a CDR of 9 in the U.S. and 14 in Kenya.
Demographic Transition Model Stage A / 1 Both high birth rates and death rates fluctuate in the first stage of the population model giving a small population growth (shown by the small total population graph).
Demographic Transition Model Stage B / 2 Birth rates remain high, but death rates fall rapidly causing a high population growth (as shown by the total population graph).
Demographic Transition Model Stage C / 3 Birth rates now fall rapidly while death rates continue to fall. The total population begins to peak and the population increase slows to a constant.
Demographic Transition Model Stage D / 4 Both birth rates and death rates remain low, fluctuating with 'baby booms' and epidemics of illnesses and disease. This results in a steady population.
Demographic Transition Model Stage E / 5? A stage 5 was not originally thought of as part of the DTM, but some northern countries are now reaching the stage where total population is declining where birth rates have dropped below death rates.
Population Pyramid Model The PPM - 'Population Pyramid Model' shows how dynamic (subject to change) population is. The model is structured to show 'snapshots' of a population at four points during its development, which are shown as Stages 1 - 4 (A - D). A country will progress through the stages.
Case Study of Population Change Over Time - DTM and Pyramids for UK (1780 - present)