Download
1 / 41
410 likes | 570 Views
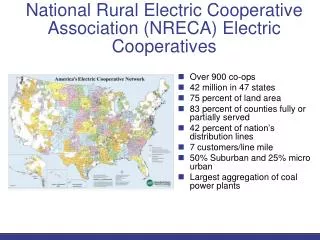
William K. Edwards Vice President of Regulatory Affairs - CFC Florida Electric Cooperative Association May 20, 2010. Background. Joint NRECA & CFC study Updates 1989 report “Rate Issues and Strategies” 20 years since last joint study – a period of stable rates. Sources.

E N D
William K. Edwards Vice President of Regulatory Affairs - CFC Florida Electric Cooperative Association May 20, 2010
Background • Joint NRECA & CFC study • Updates 1989 report “Rate Issues and Strategies” • 20 years since last joint study – a period of stable rates
Sources • Focus group and panels (CFC Forum) • Input from rate consultants and panels (NRECA Rate Summit) • Input from NRECA Innovative Energy Strategies Task Force • Presentation and Panels at Regional Meetings • Panels at CFC Independent Borrowers Meeting • NRECA and CFC newsletter articles
About the report • Intended as a helpful resource • A starting point for discussions about rates • Not an exhaustive review of rate issues • Not a “to do” list • All suggestions don’t fit all co-ops
Why This Report?New Challenges for Co-ops • Higher demand growth than IOUs • Rising construction costs • Growing interest in energy efficiency • State and Federal Mandates • Climate Change Mitigation Proposals These trends may make it harder for co-ops with traditional rates to recover costs & margins.
Co-ops Continue to Lead Industry kWh Growth Index 1974 = 100 Co-ops 4.2% Total Industry 2.4% Source: DOE/EIA
Projected Electricity Use 2008-2035 Index 2008 =100 Average Growth Rates: Co-ops v. Total Industry Co-ops 1.75% Total Industry 60% 1.0% 30% Source: Based on EIA AEO 2010
Co-ops Entering A New Building Cycle $ Billions A power plant that costs $1billion in 2000 would have Cost $2.17 billion in 2009 – IHS CERA projected (survey results) Loans Approved* *not all loan approvals (shown in green) were subsequently drawn-down Source: 2009 G&T Survey
Growing Co-op and Consumer Interest in Energy Efficiency • Co-ops • Avoid building high cost generation • Consumers • Reduce bills • Take advantage of incentives
State and Federal Mandates • 30 states & D.C. have RPS programs requiring electricity providers to acquire a percentage of generation from renewable resources. • 39 states & D.C. have adopted net metering requirements. • 19 states & D.C. have adopted Energy Efficiency Portfolio Standards.
Carbon Auction Impacts on Co-op Residential Bills This map shows how a $20 cost per metric ton of carbon dioxide (CO2) could increase the monthly bill of an average electric co-op residential consumer. DE 11% MD 13% Percent Increase: High 15% and above Medium 9% to 14% 1 Metric Ton = 2,204.6 pounds Source: 2007 EIA data Strategic Analysis Unit May 2009 Low 0% to 8% © NRECA, all rights reserved. May not be copied, reprinted, published, translated, hosted or otherwise distributed by any means without explicit permission.
Carbon Auction Impacts on Co-op Residential Bills This map shows how a $50 cost per metric ton of carbon dioxide (CO2) could increase the monthly bill of an average electric co-op residential consumer. DE 27% MD 31% Percent Increase: High 15% and above 1 Metric Ton = 2,204.6 pounds Medium 9% to 14% Source: 2007 EIA data Strategic Analysis Unit May 2009 Low 0% to 8% © NRECA, all rights reserved. May not be copied, reprinted, published, translated, hosted or otherwise distributed by any means without explicit permission.
Rates Have Increased 39% Since 2000 cents per kWh Source: EIA and CFC December 2009
Implications of Industry Trends • Higher costs • Potential for lower per-capita usage • Compatible with current rate structure?
Rate Suggestion 1Integrate Rates with the Business Plan • Cooperatives should consider including rate objectives as key components of an integrated business plan that addresses the new challenges facing the electric industry.
Why Integrate Rates? • Rates need to be compatible with technology, power supply, communications non-rate programs, member services and financial goals • Synergies are created when all co-op functions work together • Industry challenges require more extensive advance planning • Example: If a co-op is planning to implement time of use rates its technology plan needs to budget for TOU meters
Rate Suggestion 2Adopt a Rate Policy Statement Cooperative boards, working with management, should consider adopting a rate policy statement that provides specific objectives for rates that support the cooperative’s strategic goals.
Rates and rate policy provide important support of a cooperative’s strategic goals.
Elements of a Rate Policy Statement • Establish targets to meet the cooperative’s strategic financial goals • Set objectives for rate design • Examine the fairness of rates • between classes of customers • within customer classes • Identify issues other than cost of service that should be considered. • Provide other necessary direction to staff
Examples of Rate Policy Objectives • The Co-op will implement rates based on an embedded cost of service study. • Costs should be allocated to the rate classes causing costs to be incurred. • All members must provide a margin to the system. • Rates should support energy efficiency. • Collect fixed costs via fixed charges, variable costs via variable charges.
Rate Suggestion 3Support Financial and Other Strategic Objectives through Effective and Complementary Rate Design Retail rates should be designed to: • Consistently produce sufficient revenue to recover the cost of providing service to consumers, including its margin targets. • Give price signals to consumers that are aligned with the strategic objectives of the business plan. • Minimize abrupt changes in rates through use of automatic adjustments clauses. • Assure compliance with legal and tax requirements
Rate Design Communicates Price Signals Sample size = 372 Distribution Co-ops
61% of co-ops now have a wholesale power adjustment clause Sample size = 372 Distribution Co-ops
Antidiscrimination Considerations “Discrimination in rates is not permitted as between customers similarly situated; however, because a difference in charges may be justified under some circumstances, not every difference is an unlawful discrimination.” -- 29 C.J.S. Electricity § 67 (2009)
Federal Tax Law Considerations • To maintain exempt status, a cooperative must operate on a cooperative basis, which requires, among other things, equitablyallocating costs and revenues. • Excessive cross-subsidization between member rate classes may violate cooperative tax law principles. • The more a cooperative deviates from strict cost-based accounting by rate class, the greater risk it runs of not operating at cost.
Rate Suggestion 4Consider Decoupling Revenues from Sales Cooperatives should consider moving, to the extent practicable, toward recovering costs in the way they are incurred. Fixed costs and margins should be recovered through fixed charges, and variable costs should be recovered through variable charges. To the extent that this cannot be fully achieved, due to competitive pressures, cooperatives should consider adopting an adjustment mechanism clause that permits recovery of appropriate margins, regardless of kWh sales.
Aligning Costs & Charges Costs Components Charges • Consumer Acct/Sales Fixed Monthly Charge per Customer Customer • Portions of A&G, Dist O&M, Depreciation • Wholesale Power Bill Demand Components Demand Metered Demand • Transmission O&M • Portions of A&G, Dist O&M, Depreciation Energy • Wholesale Power Bill Energy Charges Variable per kWh Charge
U.S. Median Distribution Co-op % of Revenue Wholesale Power Bill Energy 65% Demand Other Costs 35% Customer
Cooperative and Investor-OwnedUtility (IOU) Customer Charges Graph based on sample of 371 distribution co-ops and 163 IOUs
Revenue Trackers ABC Electric Cooperative Ceiling 2.5 Floor 1.75
Rate Suggestion 5Align Wholesale and Retail Rates with Wholesale Cost Drivers • G&Ts should consider designing rates that reflect wholesale cost drivers. • G&T and distribution systems should consider coordinating rate policies in order to align both wholesale and retail rates to send the appropriate price signals to consumers.
Wholesale – Retail CoordinationWin / Win • Power Supply costs 65% of electric bill. • Wholesale power costs depend on load characteristics of distribution co-ops. • Wholesale rates should reflect wholesale cost drivers • Distribution systems’ rates should send the correct price signals to consumers.
Benefits of Coordinating Rates • Delay the need for new generating capacity • Delay the need for new T & D capacity • Reduce exposure to high fuel prices and high wholesale market price for electricity • Reduce coincident peak demand • Develop energy efficiency and demand response capacity resources • Better utilize technological capabilities • Help consumers to manage their bills
Rate Suggestion 6Develop a Rate Implementation Plan • Rate implementation plans assist a cooperative to achieve member, community, and regulatory acceptance of rate changes and continued satisfaction with the cooperative. • A key aspect of such a plan is internal coordination of rate objectives and activities across a co-op’s functional lines.
Implementation Plan Promotes Member Satisfaction • Assure adequate technological capabilities to support tariffs. • Introduce rate adjustments at a time that will have the least impact on consumers. • Explain co-op’s rate strategy to key audiences. • Empower consumers to manage energy use and bills.
A Plan Should Address • Schedule for ratemaking process • Assigned roles and responsibilities for successfully implementing the rate change • Approach to educating key audiences • Technology, software staff, staff training and other resources needed to implement the change smoothly
A Plan Should Address Cont. • Timing of rate adjustments • Ways to help members manage their energy usage • Timely review of rate schedules to ensure intended result • Adequate budget support
Coordination Enhances • Financial performance • Member relations • Communications • Business development • System engineering and operations • Long-term technology acquisition • Other cooperative functions
Rate Suggestion 7Review Rates At Least Annually An annual review of rate strategies and policy is recommended – more frequently if a significant change occurs.
Reasons for Annual Review • Avoid delaying rate increases • Determine if rates are contributing to co-op goals • Evaluate consumer response to rates • Modify rate design if needed