Download
1 / 23
230 likes | 352 Views
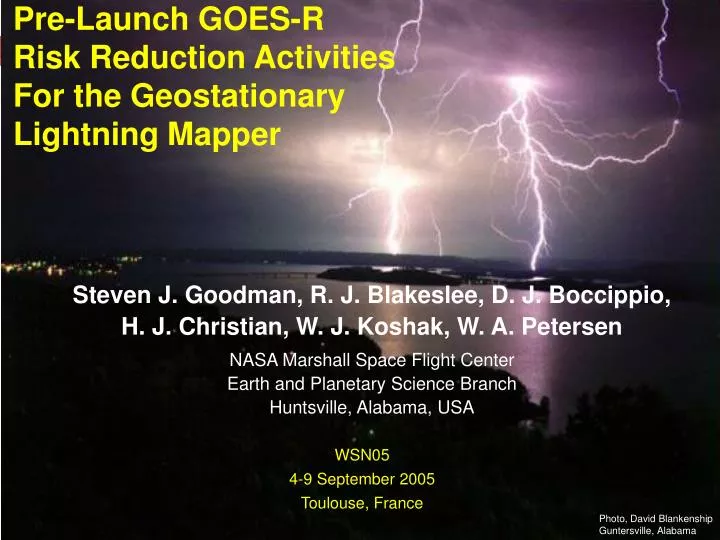
Pre-Launch GOES-R Risk Reduction Activities For the Geostationary Lightning Mapper. Steven J. Goodman, R. J. Blakeslee, D. J. Boccippio, H. J. Christian, W. J. Koshak, W. A. Petersen NASA Marshall Space Flight Center Earth and Planetary Science Branch Huntsville, Alabama, USA. WSN05

E N D
Pre-Launch GOES-R Risk Reduction Activities For the Geostationary Lightning Mapper Steven J. Goodman, R. J. Blakeslee, D. J. Boccippio, H. J. Christian, W. J. Koshak, W. A. Petersen NASA Marshall Space Flight Center Earth and Planetary Science Branch Huntsville, Alabama, USA WSN05 4-9 September 2005 Toulouse, France Photo, David Blankenship Guntersville, Alabama
Instruments Requirements Adv. Baseline Imager (ABI) NOAA Users Ecosystems, Weather & Water, Climate, Commerce & Transportation Aerosols Hyperspectral Environmental Suite (HES) Clouds NWS Solar Imaging Suite (SIS) Precipitation Baseline Instruments OAR Atmospheric Profiles Space Env In-Situ Suite (SEISS) Other Users NOS Atmospheric Radiance GOES Lightning Mapper (GLM) Atmospheric Winds NMFS Land NMAO GOES-R System Ocean Microwave Sounder/Imager PPI Coastal Waters & Estuaries Coronagraph Potential P3I NESDIS Hyperspectral Imager Space & Solar Solar Irradiance Sensor Mapping Requirements To System Solutions GPRD MRD Courtesy of Tim Walsh
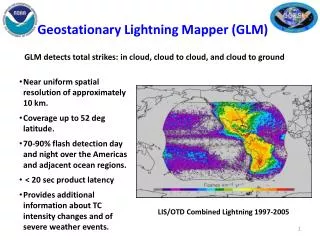
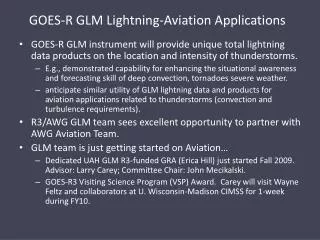
Predict the onset of tornadoes, hail, microbursts, flash floods; Track thunderstorms and warn of approaching lightning threats; Improve airline routing around thunderstorms; improving safety, saving fuel, and reducing delays; TAFs Provide real-time hazardous weather information, improving the efficiency of emergency management; NWP/Data Assimilation; Locate lightning strikes known to cause forest fires and reduce response times; Multi-sensor precipitation algorithms; Assess the role of thunderstorms and deep convection in global climate; Provide a new data source to improve air quality / chemistry forecasts. GLM Applications and Benefits
RFP Released 26 July 2005 Proposals Received 29 August 2005 Two $2M Formulation Study Awards January 2006 Downselect to One Implementation Phase Award Coverage Trade Study Optimum configuration to provide continuous, real-time, simultaneous coverage of the defined full-disk area. Configuration that would cover a hemisphere, north-to-south or east-to-west and a cost delta vs full-disk CONUS and surrounding area only and a cost delta vs full-disk GLM Formulation Status The GLM is a single channel, visible imager used to measure total lightning activity over the full-disk as part of a 3-axis stabilized, geostationary weather satellite system
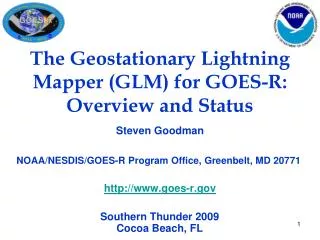
GLM on GOES Dual imager configuration GOES-R Geostationary Lightning Mapper (GLM) • NASA Lightning Mapper Concept • TRMM Lightning Imaging Sensor Heritage • Dual-Imager Configuration (8 km ifov)
LMS Dual Imager(Electronics Above Nadir Deck) 200 mm Power Converters Sunshades Video Distribution 500 mm Data Formatter & Instrument Controller Temp Control Housekeeping Lens Assemblies 250 mm RTEPs CCD Subsystems 500 mm 375 mm
Six flight-quality optical assemblies complete with narrow-band interference and solar-blocking filters have been delivered to NASA. CCD’s fabricated, integrated with breadboard drive electronics, and tested at 500 frames/sec satisfying key performance requirements (uniformity, linearity, quantum efficiency, well depth). Engineering Model of the LMS Sensor Assembly being built. Engineering Model of the LMS Electronics Assembly being built. A fully functional Real Time Event Processor (RTEP) has been built, tested, and integrated with a CCD subassembly. Performance exceeds operating speed and S/N requirements. Instrument Risk Reduction Status
Supercell Most Intense Electrical Storms on Earth Extreme Lightning Rate StormsObserved by TRMM LIS(Cecil et al., MWR, 2005) • *Annual number of casualties due to lightning • US ~ 1000/yr • Deaths ~ 80-100/yr • Worldwide ~ 25,000/yr • *Ron Holle, 2004 Cecil et al., Mon. Wea. Rev., 2005)
Continuous GEO Total Lightning will identify severe storm potential Process physics understood Ice flux drives lightning GLM GOES E View Storm-scale model for decision support system Physical basis for improved forecasts Updraft Intensifies IC flash rate controlled by graupel (ice mass) production (and vertical velocity) Demonstrated in LEO with OTD & LIS Vortex Spins-up Lightning jump precedes severe weather Lightning improves storm predictability
TRMM LIS-Lightning: May 1999 Stroud, OK Tornado GOES-R GLM Perspective Mapping storm initiation, growth, decay • TRMM provides us a huge database of paired lightning, radar, IR and passive microwave observations (training, validation) • Over entire tropics & subtropics (generalization) • Total lightning increases as storm intensifies – can increase lead time for warning of severe and tornadic storms
24 Aug 05 26 Aug 05 28 Aug 05 29 Aug 05 Hurricane Katrina: Lightning Imaging Sensor (LIS) LIS Background Images read out once per min 4 km ifov @ 777.4 nm Orbit swath 600 km
North Alabama Nowcasting Short-term Forecasting Test Bed
Tennessee Alabama NASA North Alabama Lightning Mapping Array (LMA) Map (10 stations) 10 stations over 65 x50 km diameter area http://branch.nsstc.nasa.gov/ One hour of real-time data
North Alabama Lightning Mapping Array (LMA) • Network of 10 detectors centered about HSV (NMT heritage) • Computes 4-D location of all electrical discharges (“flashes”) within LMA (CG…and IC, CC, CA) • Flash location overlaid on radar and satellite imagery and updated every minute • Trend information identifies growing/decaying storms • Validation for TRMM LIS • NASA Senior Review to extend mission approved
Total Lightning Impacts Decision Making at HUN • Has directly contributed to several correct severe warning decisions at HUN, OHX, and BMX. • “…the LMA density map gives you a great overall view of where storms with intensifying updrafts are located. So it gives you a good map of where to concentrate attention.” • “I believe the flash density rates were the primary factor in holding off on a warning.” • Data archived by WFO • Used in Warning Event Simulator for office training
0.5 º SRM 1.5º SRM Ill-defined Rotational Couplet 0.5 º Refl LMA Source Density May 6, 2003 Case 1236 UTC
0.5 º SRM 1.5º SRM Broad Rotational Couplet 0.5 º Refl LMA Source Density Lightning Jump May 6, 2003 Case 1246 UTC
LMA Source Density vs. Time Jump Source Density F1 12 min 10/18/04 October 18, 2004 Case • Rotating storm near edges of radar coverage • LMA provided forecaster extra confidence in tornado warning
VIL LMA 2-min NLDN 5-min Composite dBZ Total Lightning Data in AWIPSScience and Technology Risk Reduction • Lightning Mapping Array • Ground based VHF network (Ch 5@72 MHz) • Continuous 3-D total lightning • Domain 400 km x 400 km • 17 height levels, 2 km flash density • Auto-loads 32 frames of 2 min netCDF grids via SR Frame Relay Scientific Benefits to WFO’s • Increased Situational Awareness, Confidence Limits • Rapid Update- Potential for increased lead time, reduced FAR • Identification of intensifying and weakening storms, potential severe storms, microburst wind shears, CG threat area • Fills gaps in radar coverage AWIPS 4-panel display at the HUN WFO
Lightning Flash Trend for Tornadic Supercells Spatial resampling at 1 km - 8km
Conclusions • The operational demands on the spacecraft and ground systems are well-understood • On-going instrument, science, algorithm, and forecaster benchmarking studies will reduce risk and accelerate the transition from research to on-orbit operations • http://thunder.msfc.nasa.gov (LIS) • http://weather.msfc.nasa.gov (SPoRT Center, Lightning Workshops) • http://branch.nsstc.nasa.gov (Real-time LIS and North Alabama LMA) • http://osd.goes.noaa.gov (GOES-R Program Office)